2023 National Data Report
HOW TO UTILIZE THIS REPORT
This report is designed to be interactive and help you make informed planning and strategic decisions for your organization moving forward.
Part 1
The report starts by sharing national 2023 data trends, progressively narrowing its focus to trends related to specific organization types and key states.
Part 2
The report shows you how to identify specific next steps and relevant resources for your organization based on your 2023 save rate and how it compares to 2022.
Part 3
Finally, the report shares insights from the first quarter of 2024 (January - March) to illustrate our collective progress this year.
Appendix
To learn more about our advanced new data model and how we leverage AI to maximize lifesaving impacts, visit the Appendix.
Don’t have time for the deep dive? Skip to Part 2 to use your 2023 save rate and how it compares to 2022 to connect directly to relevant resources for your organization.
Introduction
In 2016, Best Friends set the bold goal to lead the country no-kill in 2025. However, one significant hurdle was clear from the start: industry data was severely lacking. At that time, no one even knew how many animal shelters existed, and without clear numbers, it was impossible to measure progress. So, we committed to improved data and transparency and started a massive effort to collect data from every shelter in the country.
Since that time, our primary method of data collection has come a long way, from volunteers conducting records searches and shelter calls to the co-founding of Shelter Animals Count, the launch of Shelter Pet Data Alliance, and the recent introduction of machine learning into our efforts.
For the 2023 data release, Best Friends is pleased to provide the most comprehensive and sophisticated dataset in animal welfare. The sophistication lies in how the data is collected and analyzed, but we did not stop there. We have paired data insights with specific, actionable steps to help animal welfare professionals and city leaders take their shelters no-kill.
Today, government officials, boards of directors, donors, the media, and the community increasingly demand leaders back up their strategies and operational decisions with clearly articulated data. Best Friends Network realizes that many animal welfare leaders did not enter the field for their love of data analysis and we are committed to providing resources to enable leaders to use data in their daily decision making and to strengthen their reporting.
In addition to providing direct connections between 2023 data trends and relevant resources to address lifesaving challenges contained in this piece, the Best Friends Network offers a variety of data-related resources, including:
- Shelter Pet Data Alliance (SPDA) is a free interactive data platform for shelters and rescues designed to automate data reporting, provide timely data analysis, and connect them with support to help increase lifesaving. Learn more and get started for free.
- One-on-one data consultation with Best Friends data scientists, available to Best Friends Network Partners that use SPDA.
- Online Data content, including webinars, articles, and examples of shelters successfully leveraging the power of their data (Gathering Data for Shelters (e-learning module), Lifesaving with Latest Data Technology Webinar Series).
As with past years, the Best Friends 2023 National Dataset is a comprehensive look at the state of animal welfare today. It includes statistics from over 96% of the nearly 4,000 brick-and-mortar shelters in the country. Because ongoing challenges from the pandemic have affected animal shelters in different ways, Best Friends used our data modeling to focus on how communities and shelters have recovered or struggled as they continue to adjust to the new normal.
Part 1: 2023 Trends
Yearly Dog & Cat Intake
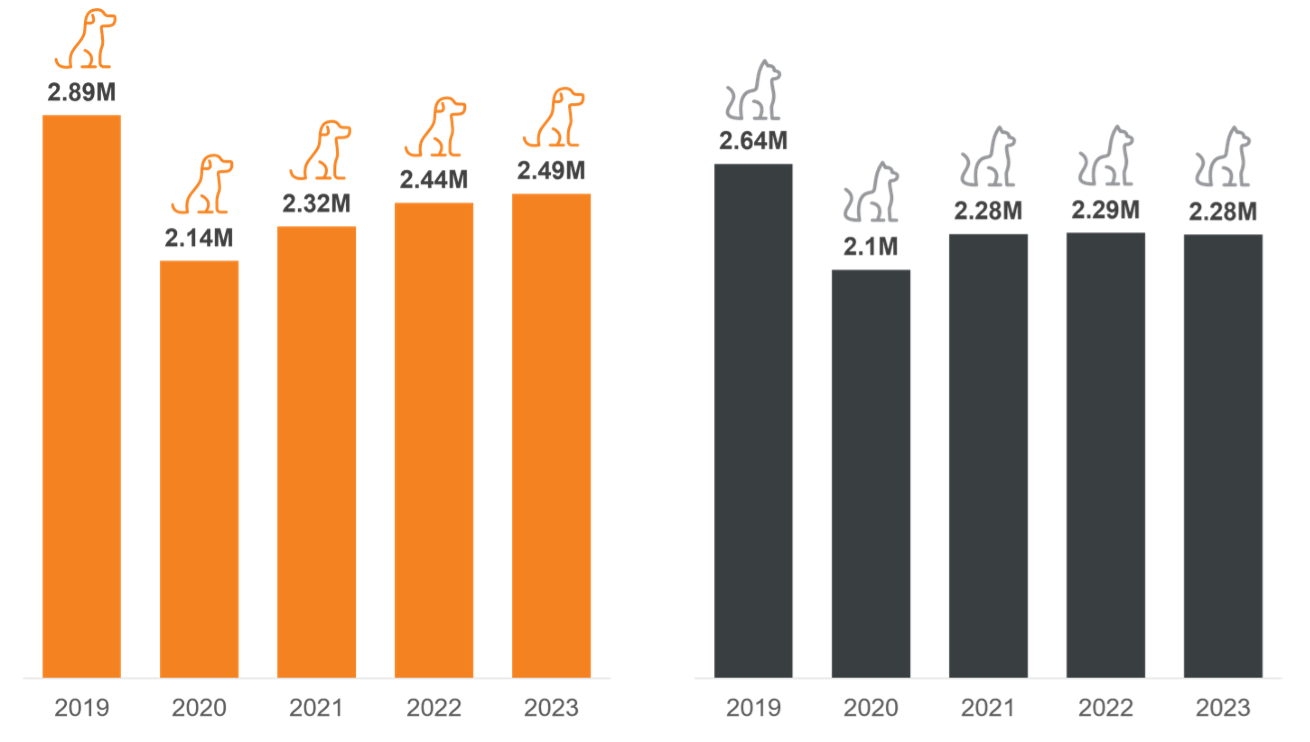
Since 2021, animal shelters have continued to report increases in animal intake and animals killed. While intake has not returned to its 2020 low, post-pandemic shelter intake held steady in 2022 and 2023 at approximately 4.7 million, with cats seeing a slight decline in intake and dogs experiencing a slight increase in intake.
Yearly Dog & Cat Lifesaving Gap
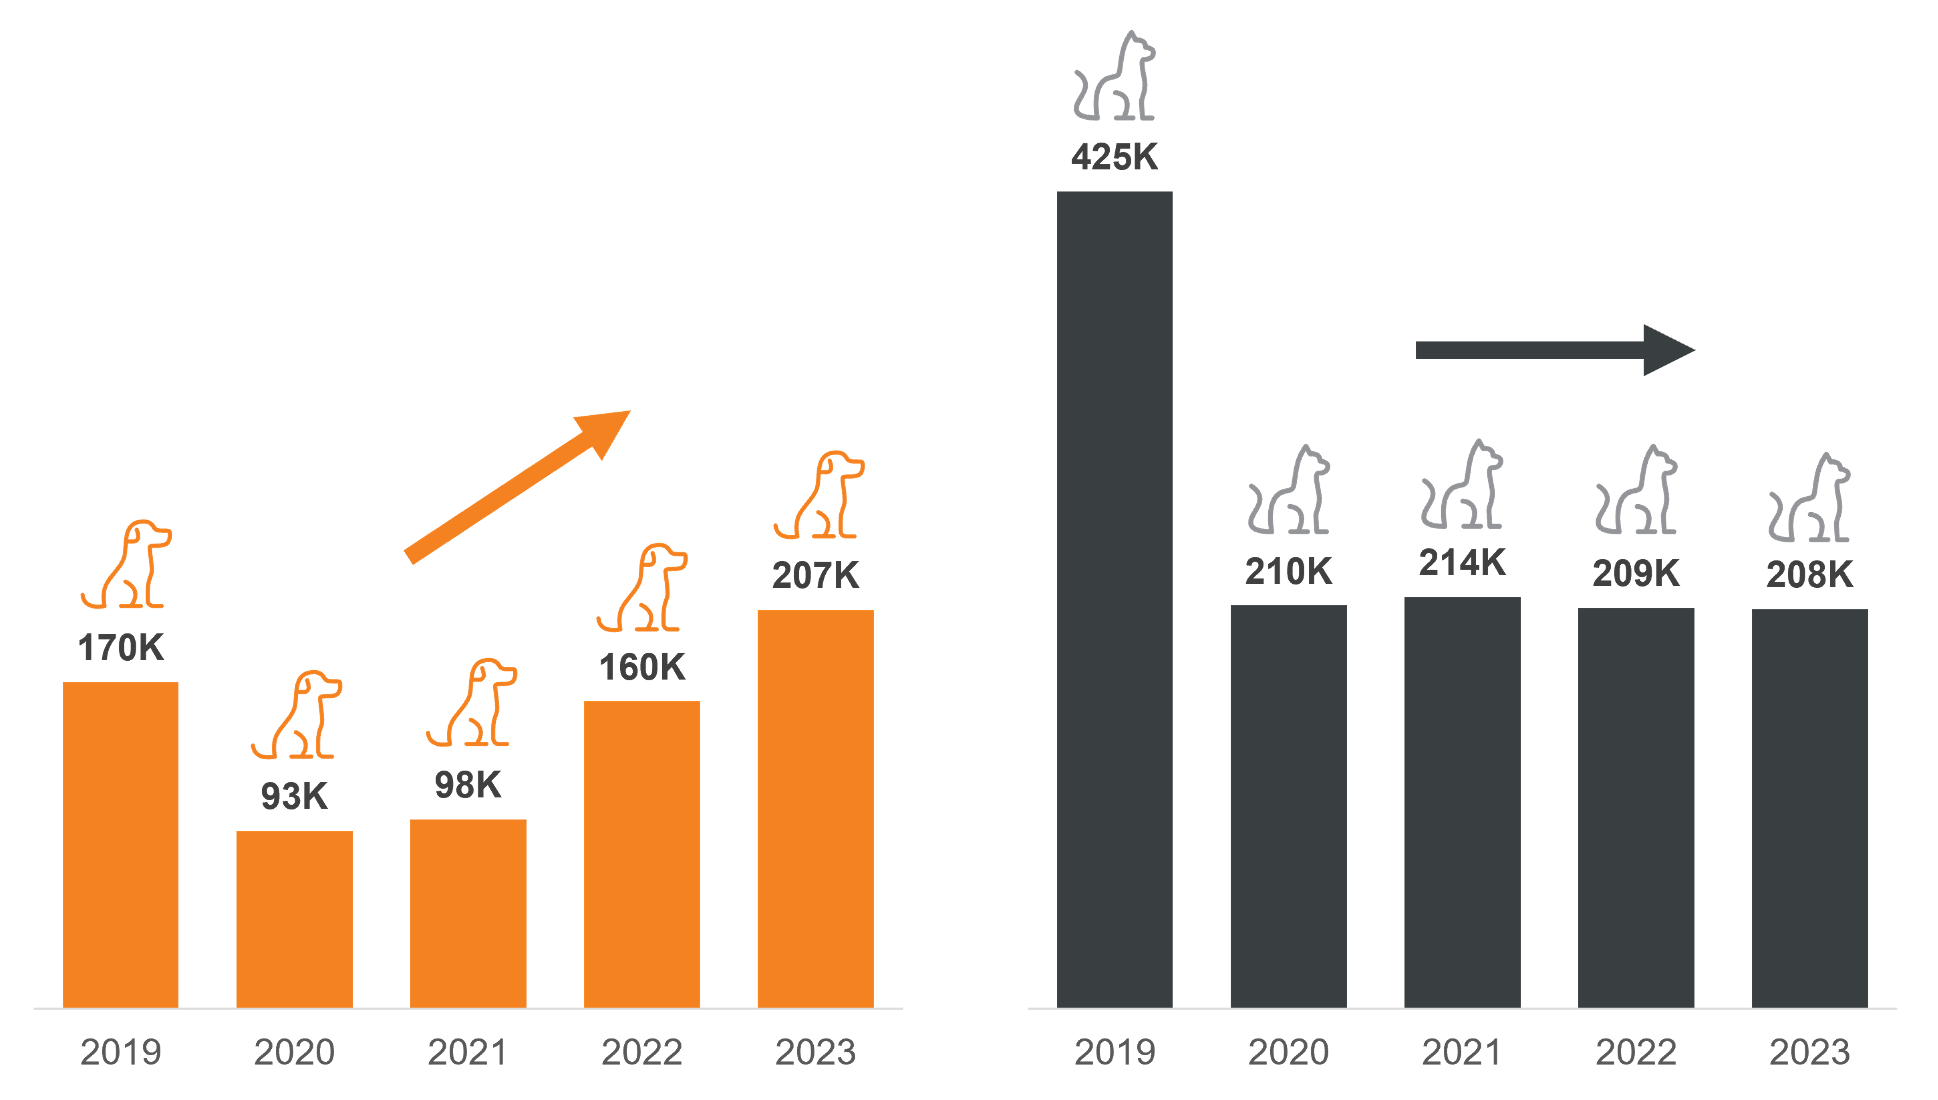
The number of animals killed in 2023 increased modestly over 2022, but at a slower rate than in previous years; the most significant year-over-year increase in killed were observed from 2021-2022.
Even with this increase, the number of animals killed is still well below pre-pandemic levels when you consider dogs and cats together.
However, a different picture is emerging between cats and dogs: the number of dogs killed exceeds pre-pandemic levels. Cat lifesaving progress has been maintained since 2020.
Data in 2023 has shown changing policies around intake of community cats and implementing TNVR have significantly improved lifesaving in many communities.
Unsurprisingly, modeling of 2023 year-over-year changes have shown that shelters with a larger share of dog intake were the most likely to suffer setbacks in lifesaving from 2022 to 2023.
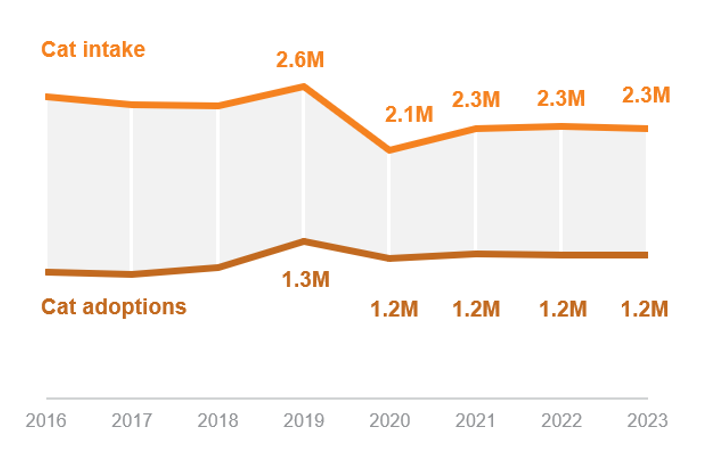
While adoptions have increased since 2022, they haven’t returned to 2019 (pre-pandemic) levels.
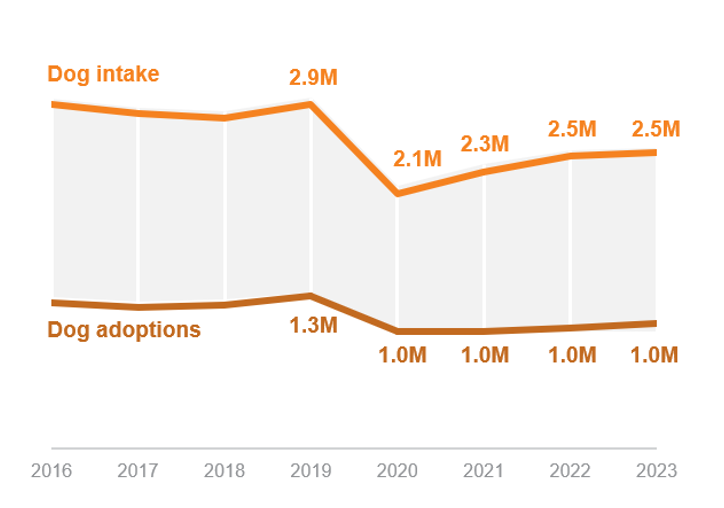
In fact, dog adoptions decreased by 17% for municipal shelters in 2023 and decreased by 26% in private shelters without government contracts since 2019.
Cat adoptions trends were mixed with municipal shelters seeing a 16% decrease in adoptions and private shelters without contracts seeing cat adoptions increase by 11% compared to 2019.
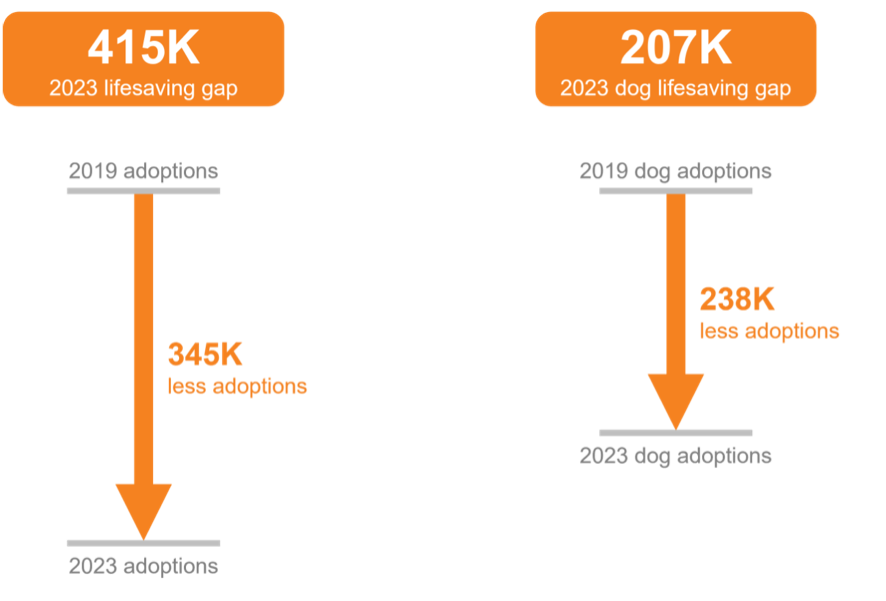
Again, while decreases in adoption are certainly a concerning trend, there is hope. The national lifesaving gap for dogs and cats in 2023 was 415,000, while the annual decrease in adoptions in 2023 compared to pre-pandemic 2019 was 345,000.
Theoretically, if we were able to return adoption rates to pre-pandemic levels, our national lifesaving gap would be nearly closed.
When considering dogs alone, the national lifesaving gap for dogs in 2023 was 207,000, while dog adoptions have decreased by 238,000 annually compared to 2019.
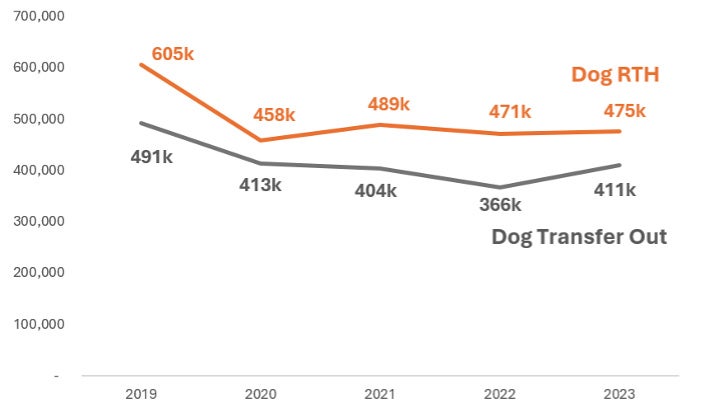
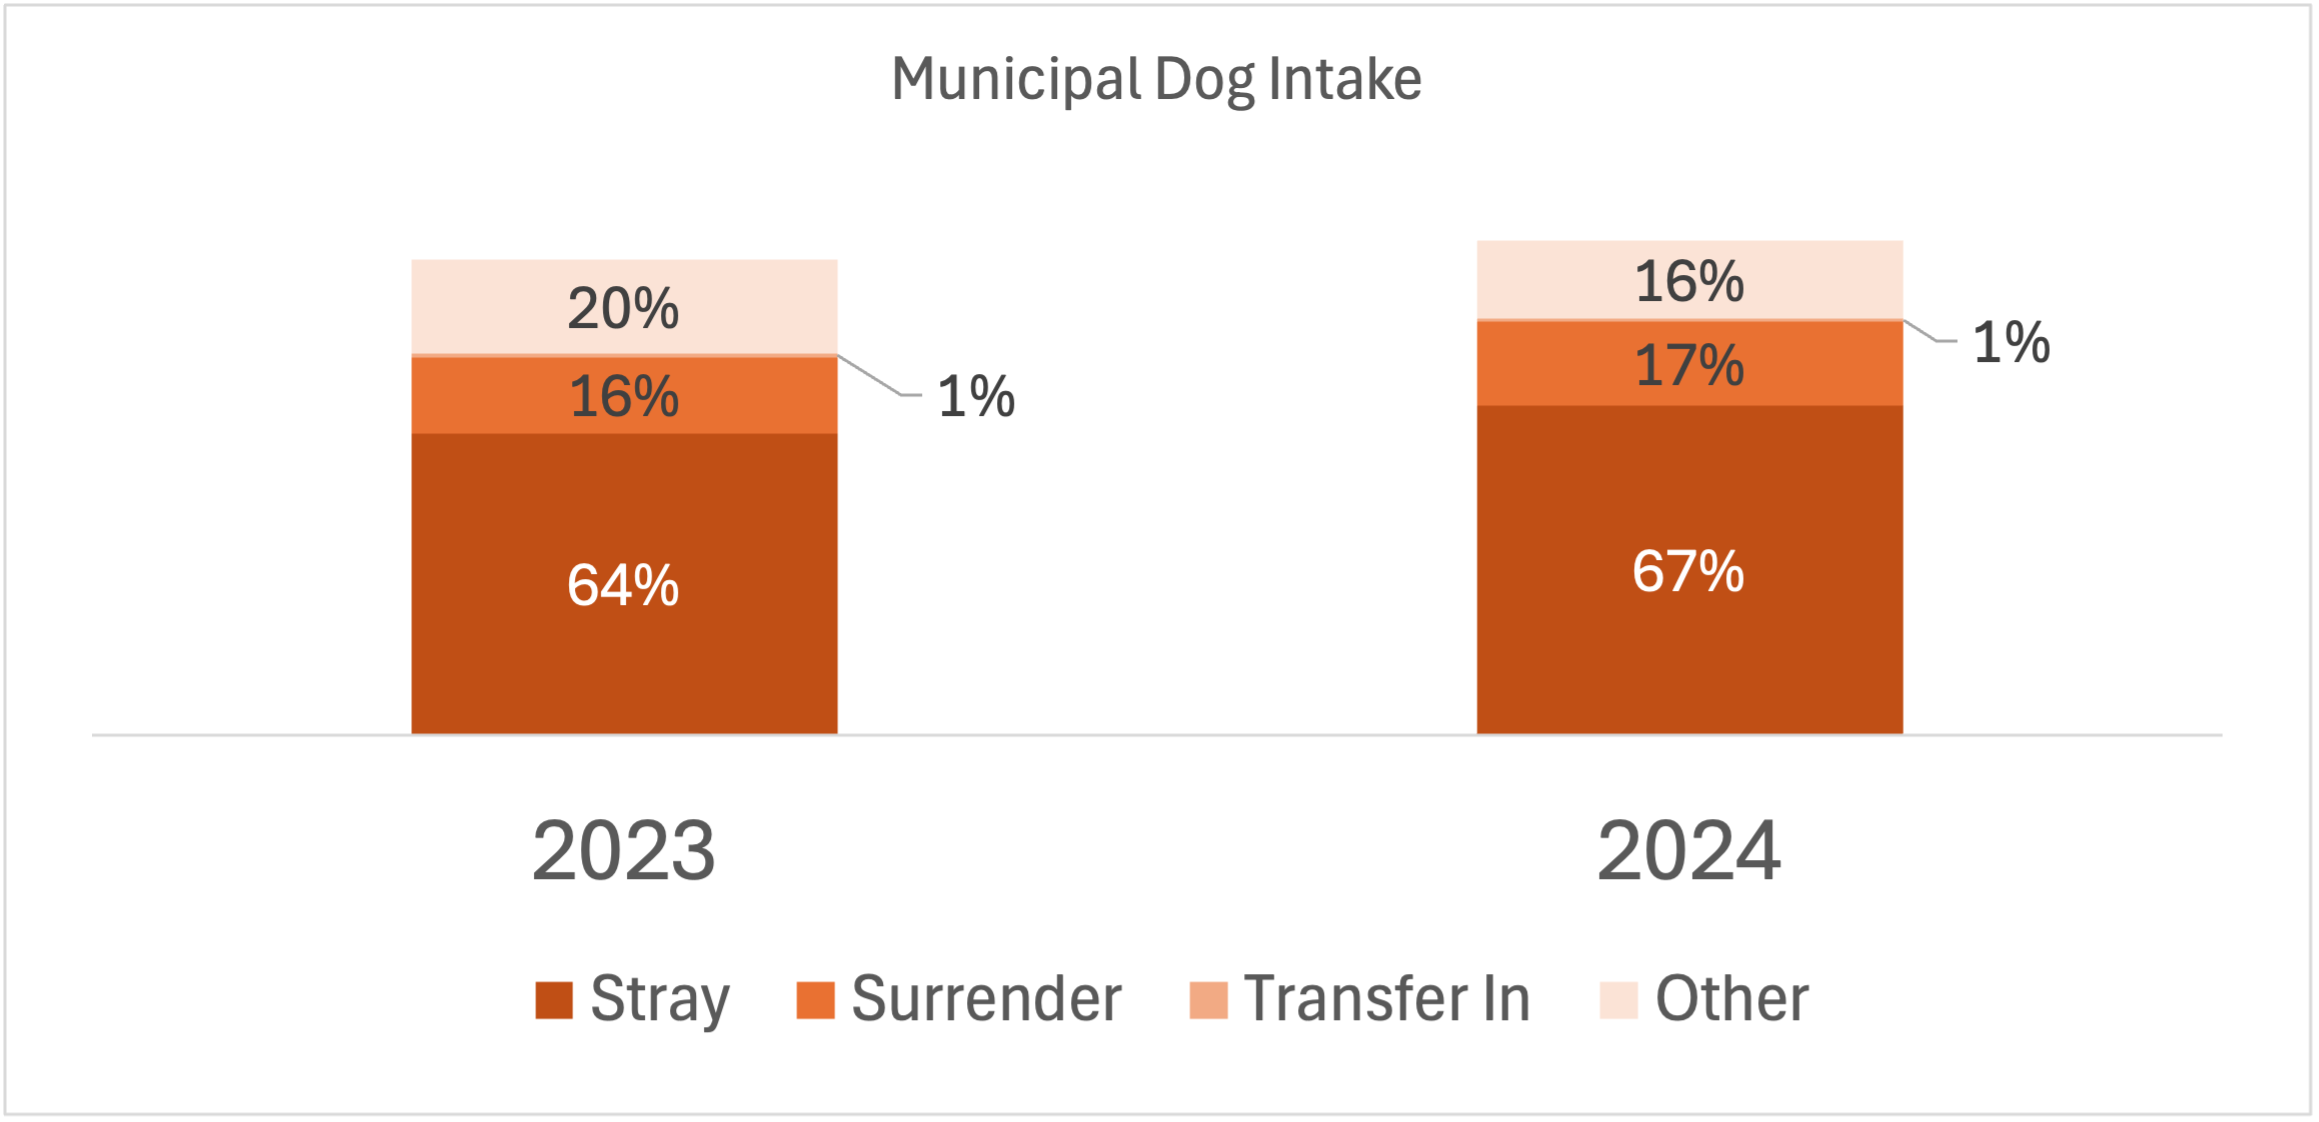
Transfers out have not rebounded to pre-pandemic levels for dogs, even in the face of increases in intake from 2021 to 2023. Dog return-to-home (RTH) rates have also decreased substantially in post-pandemic years even though a larger percentage of incoming pets are strays vs owner surrenders. Taken together, this is a concerning pattern because dog transfers out and RTH remain at levels comparable to 2020 when intake was at an all-time low, and dog intake has only increased since that time.
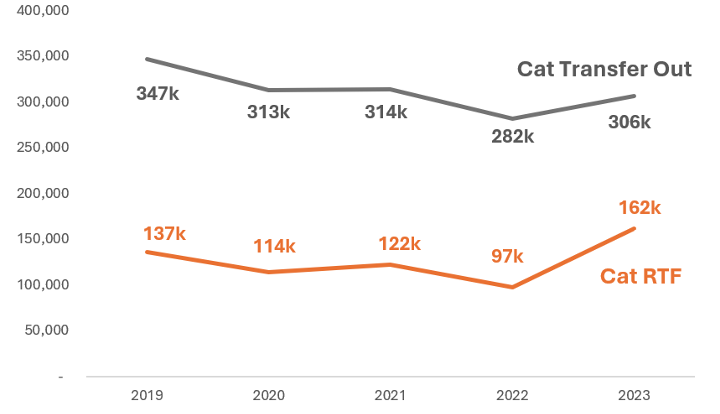
There has only been a slight decrease in transfers out for cats even though intake dropped sharply in 2020 and remained at relatively stable levels since 2021. Community cat programming is continuing to be a source of live outcomes for cats, and 2023 saw a substantial increase in return-to-field outcomes. Taken together, these patterns indicate that avenues for cat live outcomes were not largely influenced by the pandemic.
Pet Acquisition
To place more pets with adopters, shelters and rescue groups must compete more effectively with breeders. According to research conducted by the American Pet Products Association on pet acquisition in 2023–2024, across every generation, breeders were a more popular source of dog acquisition than shelters or rescues.
Rescue groups were the least popular source of dog acquisition across generations, but the percent of respondents indicating that one or more of their dogs were acquired through a rescue group was the lowest among GenZ respondents and was highest for Boomers.
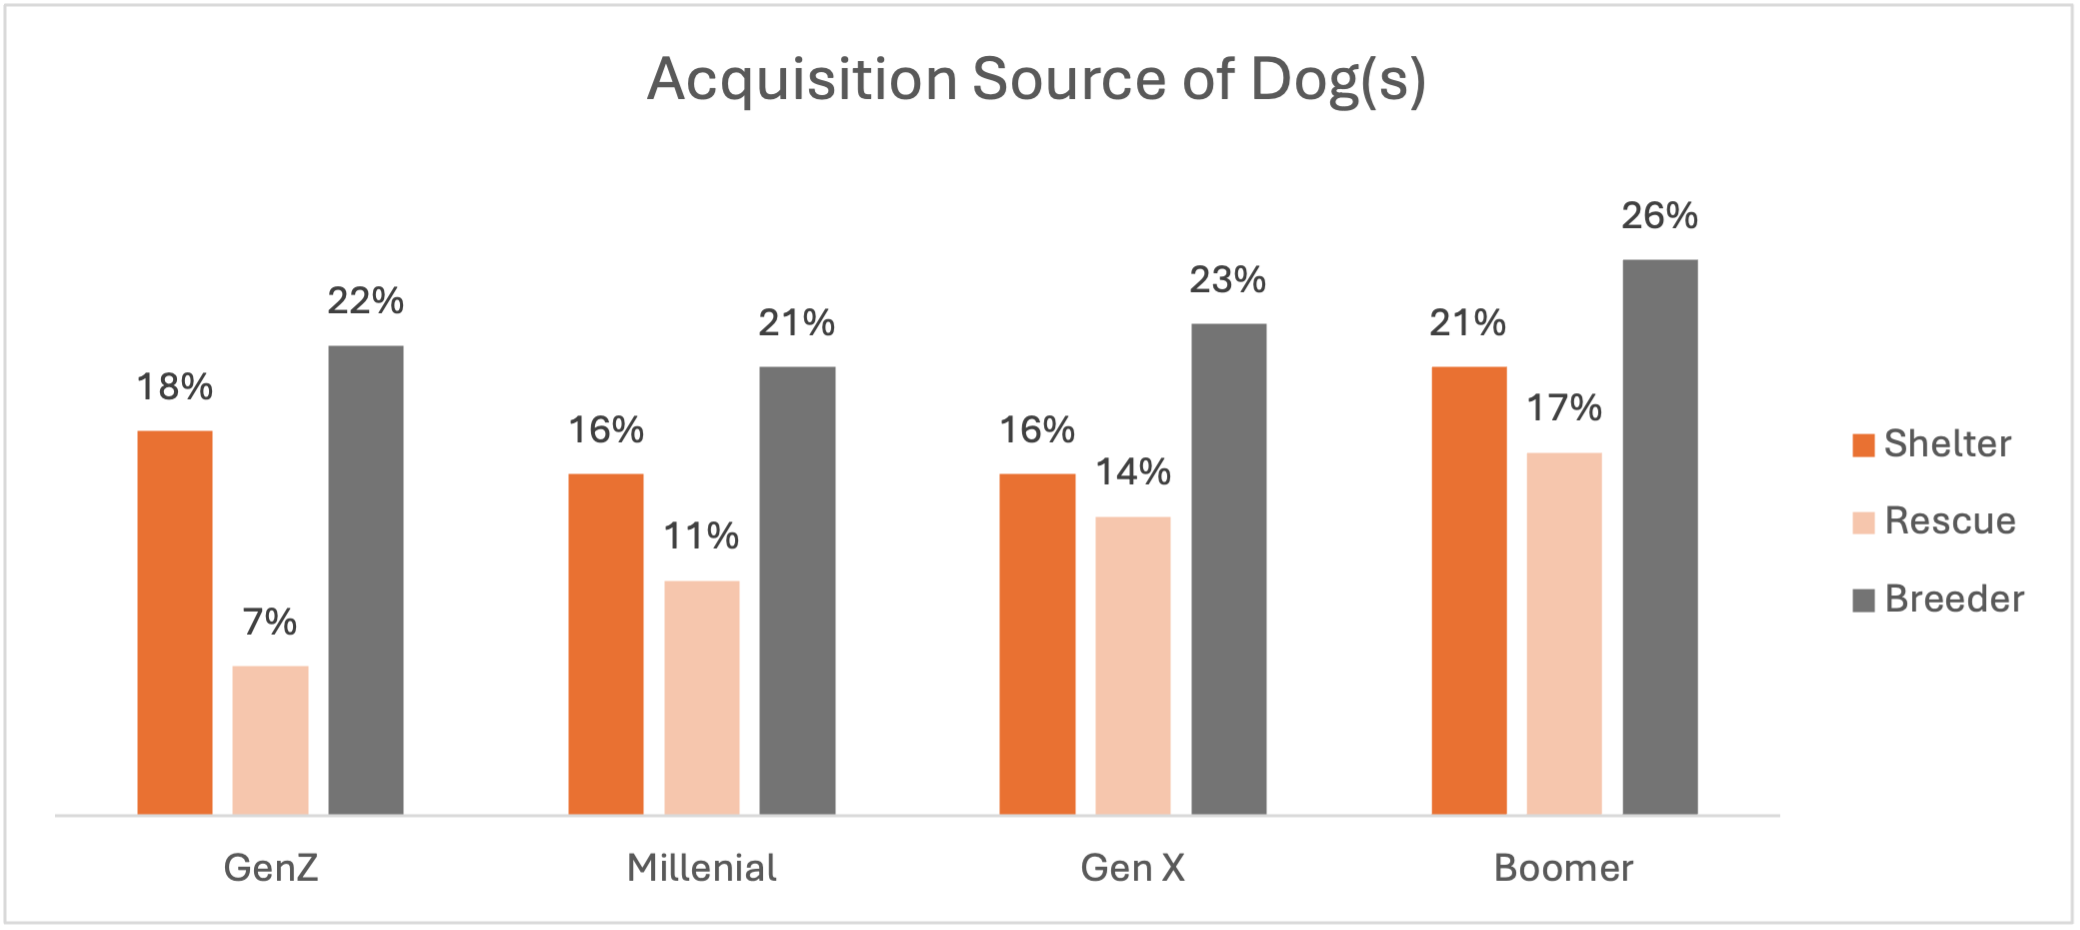 *Note: Respondents who owned multiple dogs could select multiple acquisition sources if dogs came from different sources.
For cat owners, adoption was the clear preference and acquisition from a breeder was rare, though slightly more popular with younger generations. When considering a shelter or a rescue group, shelters remained the most common location for adoption, but rescue groups were slightly more popular for older generations.
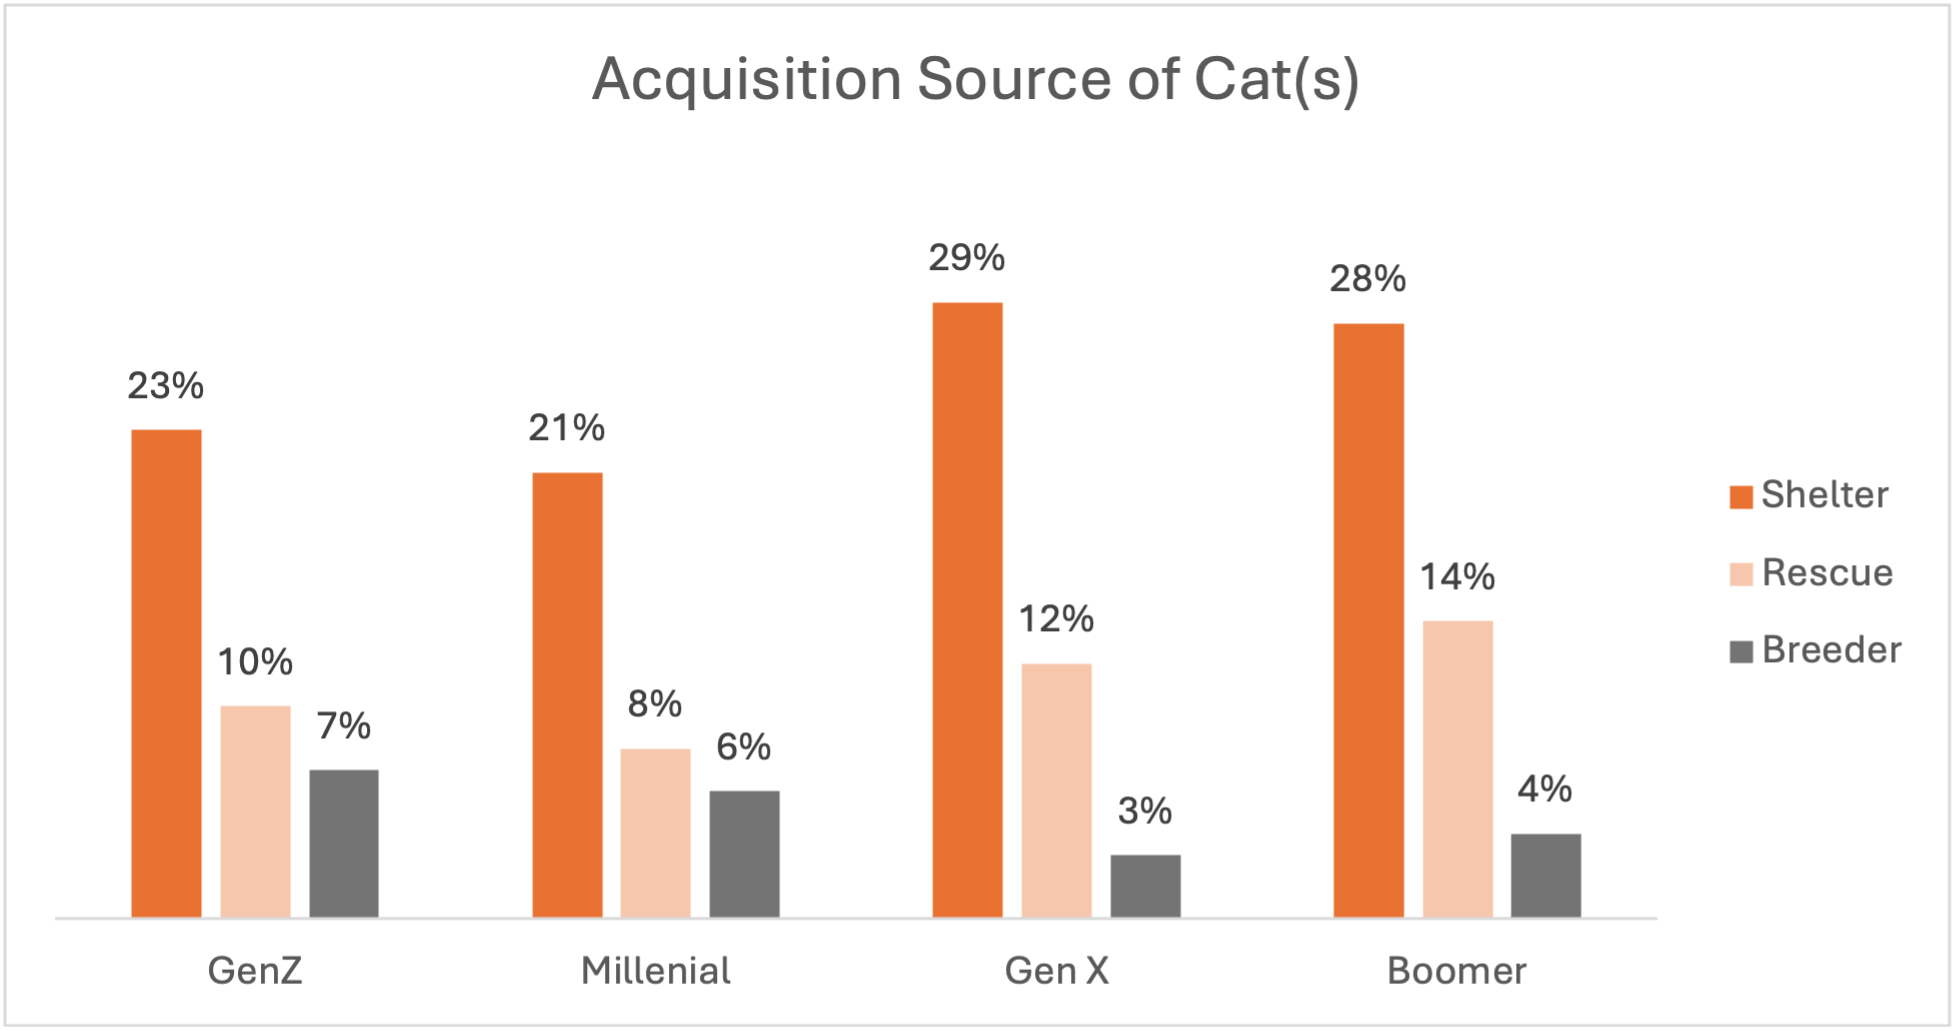 *Note: Respondents who owned multiple cats could select multiple acquisition sources if cats came from different sources.
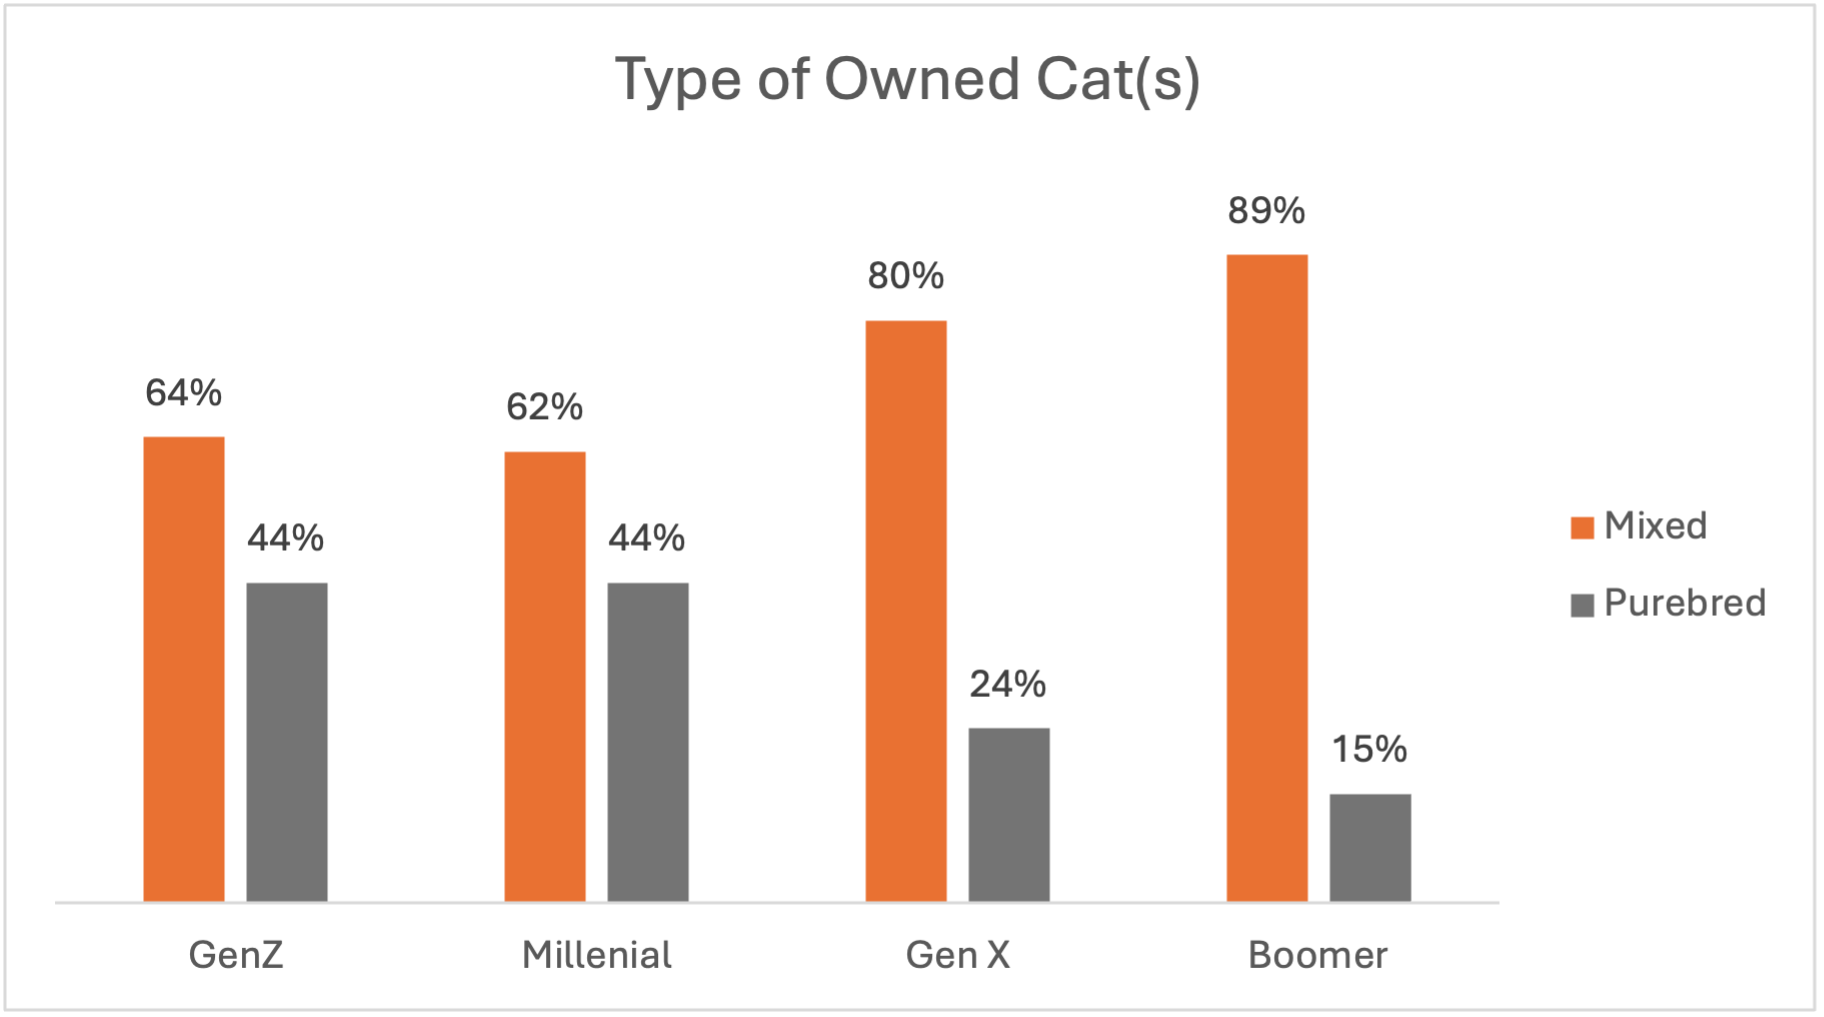
What could be contributing to breeders’ high market share? Best Friends is continuing to investigate this issue in more detail, but one factor is preference for purebred animals. Overall, younger generations were more likely to own at least one purebred dog and much more likely to own at least one purebred cat.
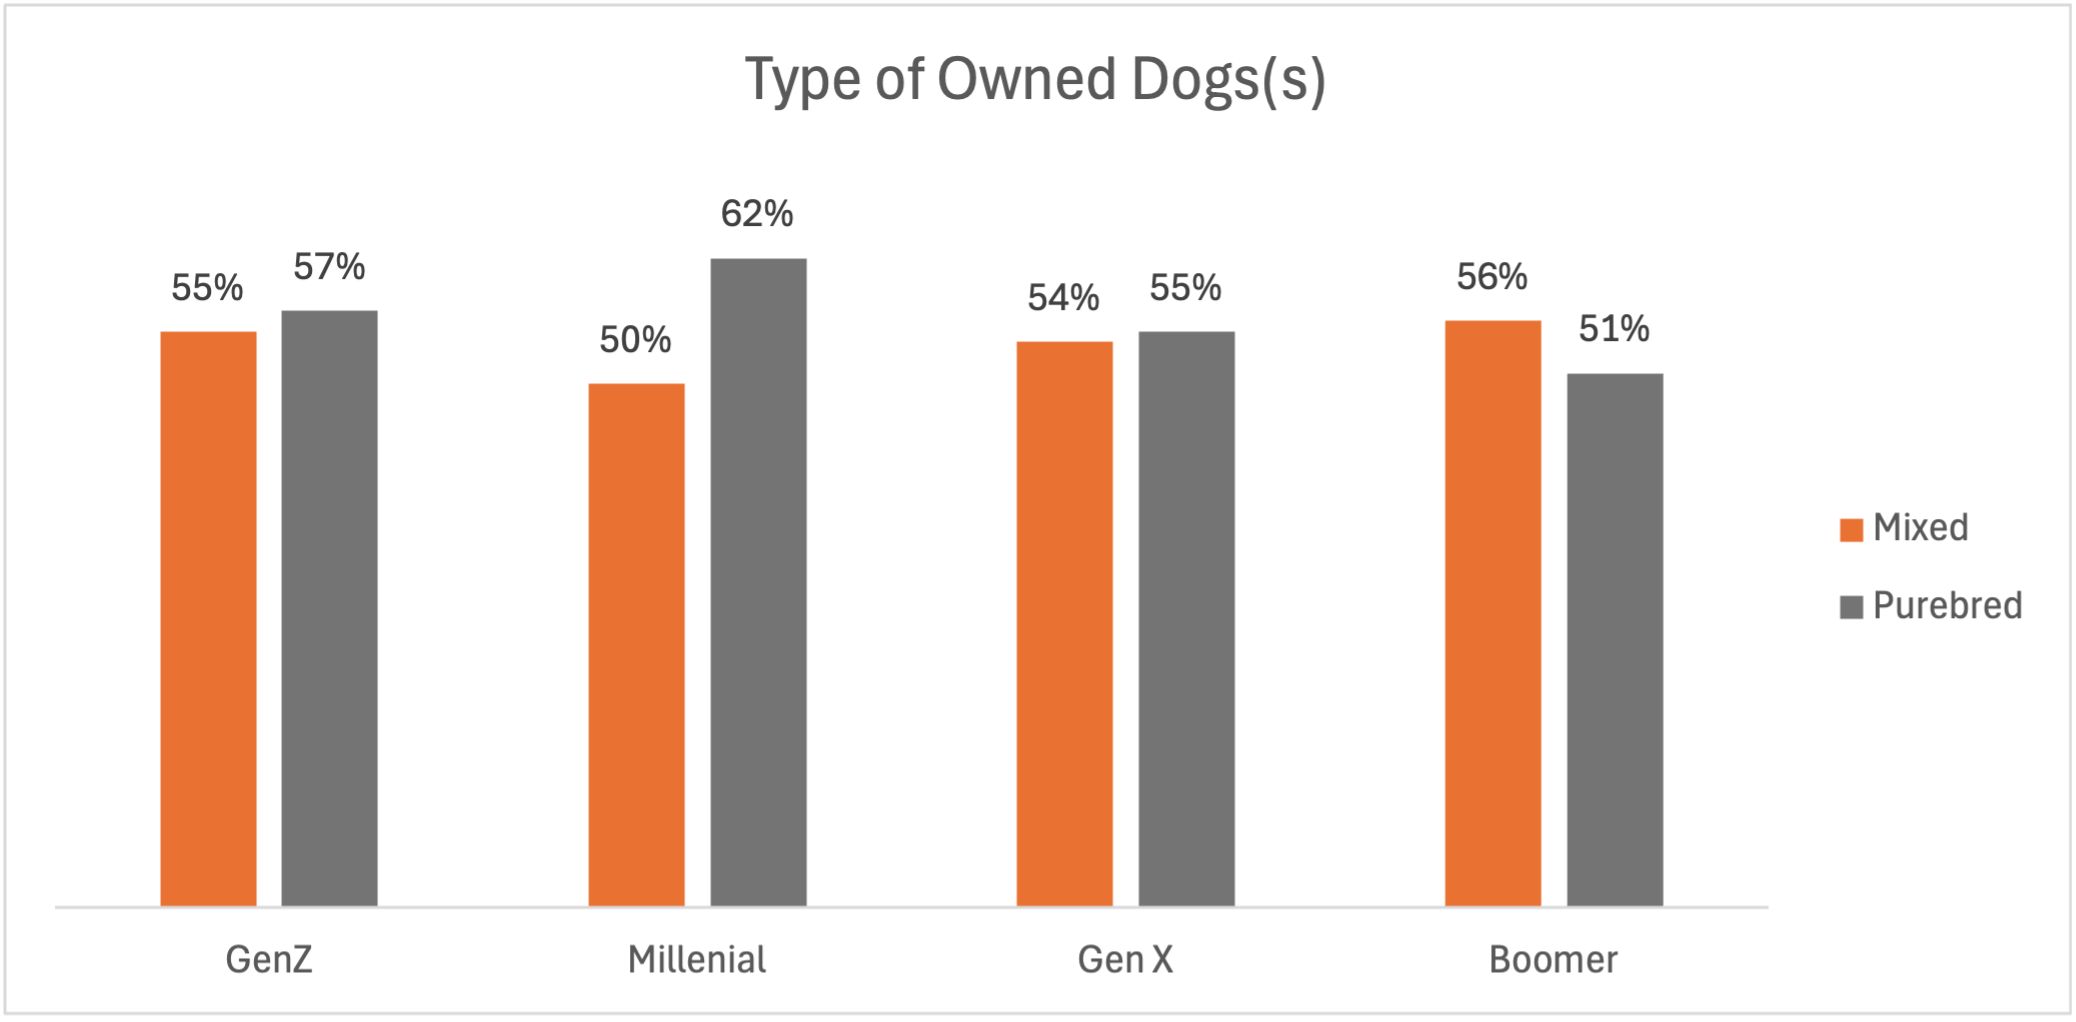
 *Note percentages can add up to over 100% because respondents who owned multiple dogs/cats could indicate purebred and mixed breed if both were owned.
National Lifesaving
Starting in 2020, the COVID-19 pandemic introduced new complications for both shelters and rescue groups that required our industry to pivot from many proven strategies and build new, pandemic-friendly approaches in real-time. While we have entered a period of comparative normalcy and have had time to establish amended best practices for our “new world” overall, we have yet to return to pre-pandemic levels in many key lifesaving areas.
Every shelter in the U.S. has felt this strain, but the impacts have not occurred simultaneously. Some shelters experienced a peak in animals killed in 2021, while others peaked in 2022 or 2023.
To understand detailed reasoning for use of word “kill” vs “euthanized” please review this article.
Our latest data indicates that in 2023, around 415,000 dogs and cats were killed in our nations shelters because they didn’t have homes, an increase of 46,000 since 2022.
415,000
Dogs and cats killed in 2023
As of the end of 2023, the national save rate was 82.6%, a slight decrease when compared to 83.8% in 2022.
82.6%*
National save rate 2023
*Best Friends is committed to publishing the most accurate and current data available; any variance from previously published numbers is due to ongoing 2023 data collection.
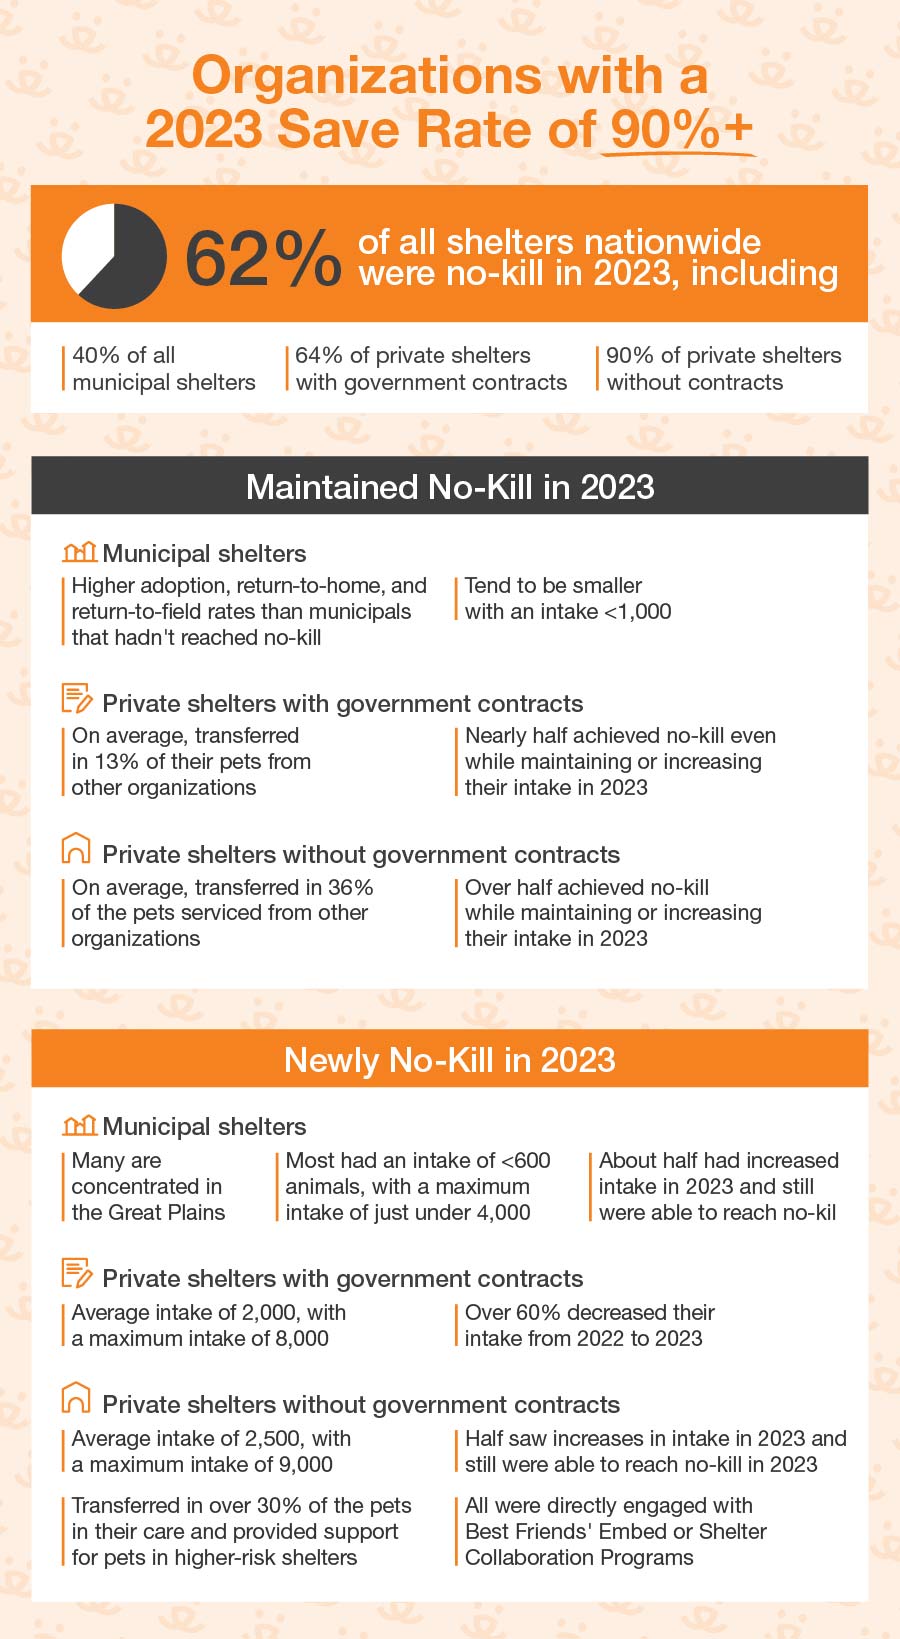
While 2023 proved to be a challenging year for shelters and rescue groups nationwide, data continues to illustrate that no-kill nationwide is achievable and sustainable, even in this complex environment.
88%
of no-kill shelters in 2022
remained no-kill in 2023
68
new shelters achieved
no-kill in 2023
Putting the pandemic years in a wider context, we can see that while the hurdles are undeniable, we have still made substantial progress over time. When we go back to 2016 — when Best Friends increased our investment in data — there has been a 60% reduction in dogs and cats killed in our nation’s shelters. In other words, even though killing increased in recent years, the field still made significant overall improvements in lifesaving in the last eight years.
To gain more insight into the trends impacting the national save rate, let us dive into key factors that impact lifesaving.
Intake is the biggest predictor of next year’s outcomes.
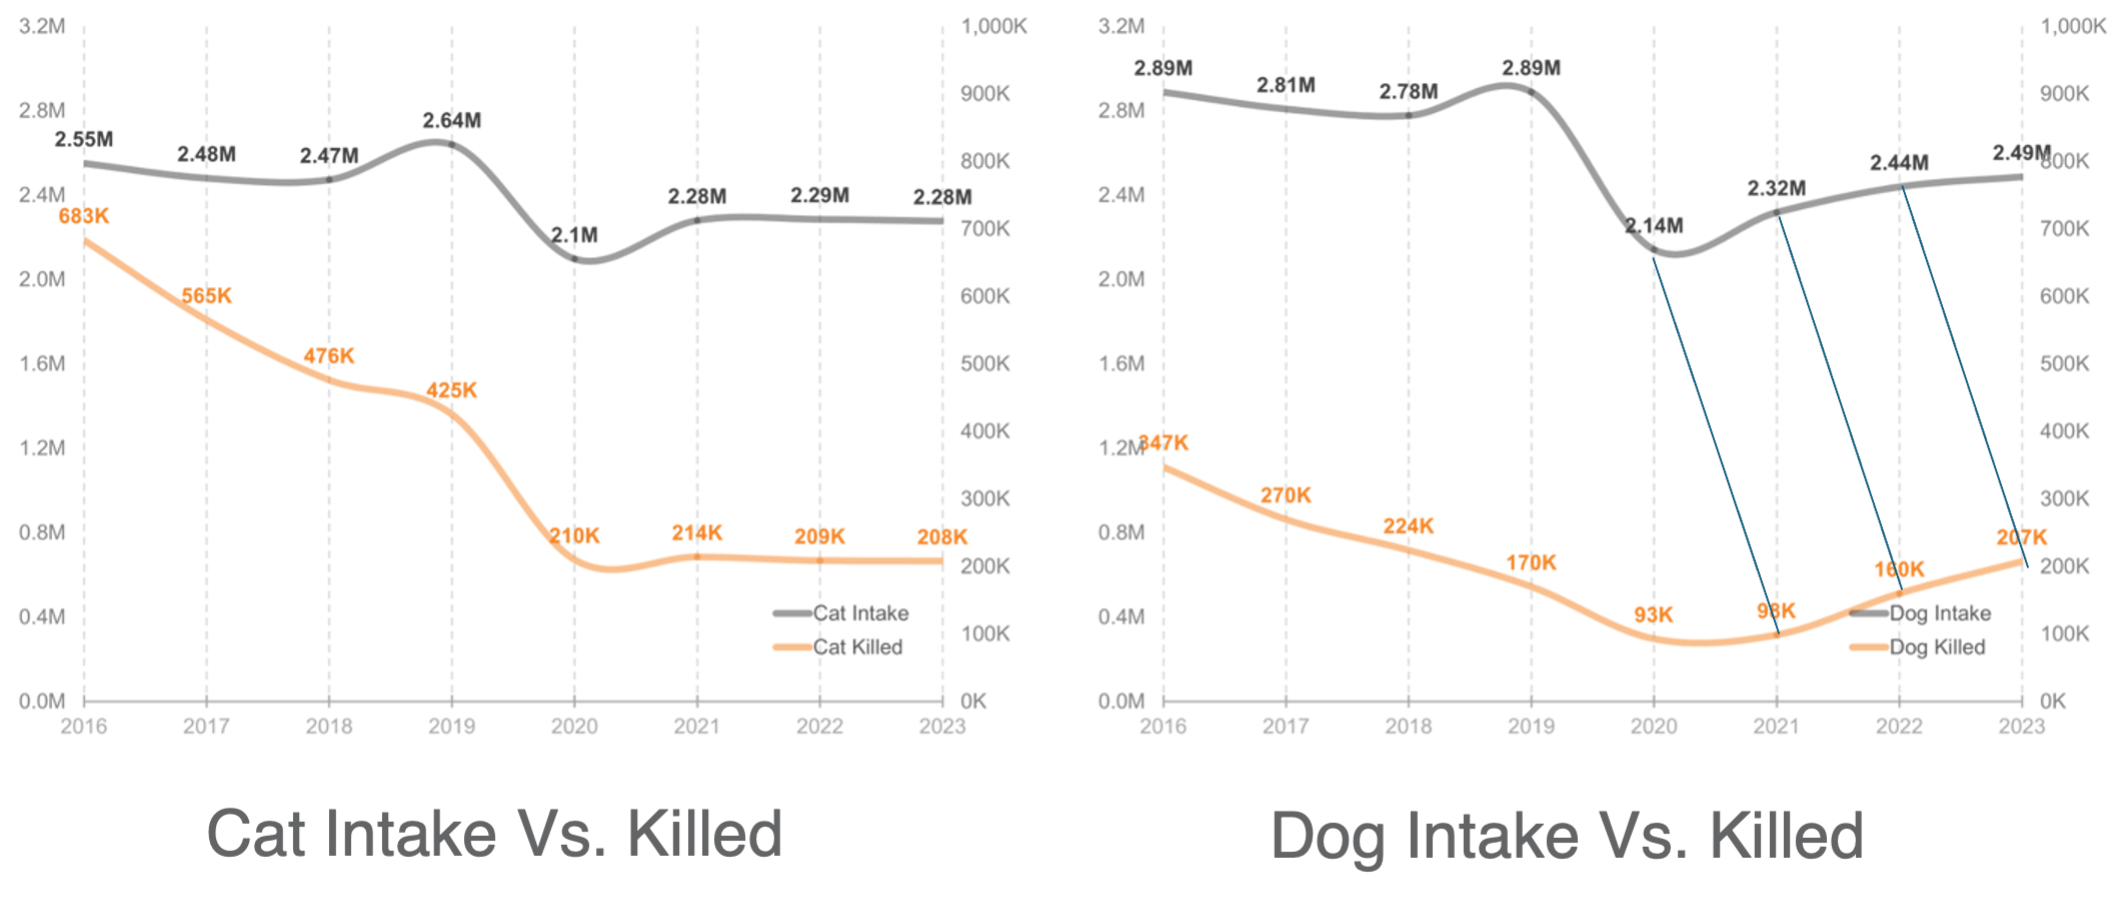
Since the pandemic began, the single biggest predictor of the number of animals killed has been intake — as intake rises, so do negative outcomes. With cat intake leveling off, cat killed rates have also remained largely unchanged since 2021. However, as we have seen increases in dog intake since 2021, we’ve continued to see increases in dogs killed rates.
With this relationship in mind, we can expect to kill fewer animals if intakes decrease. However, we can also work to change this predictive relationship by having pre-planned pathways to move intaked animals into homes quicker. Returning dog adoption rates to 2019 levels is a key factor in making that change.
Not all shelters are facing the same challenges.
National numbers don’t tell the whole story. Each community and state did not equally experience setbacks and/or progress.
While every shelter in the U.S. has felt this strain, timing has varied. For some shelters, the increase in animals killed peaked in 2021, while others peaked in 2022 or 2023. See specific trends for states with the highest lifesaving gaps.
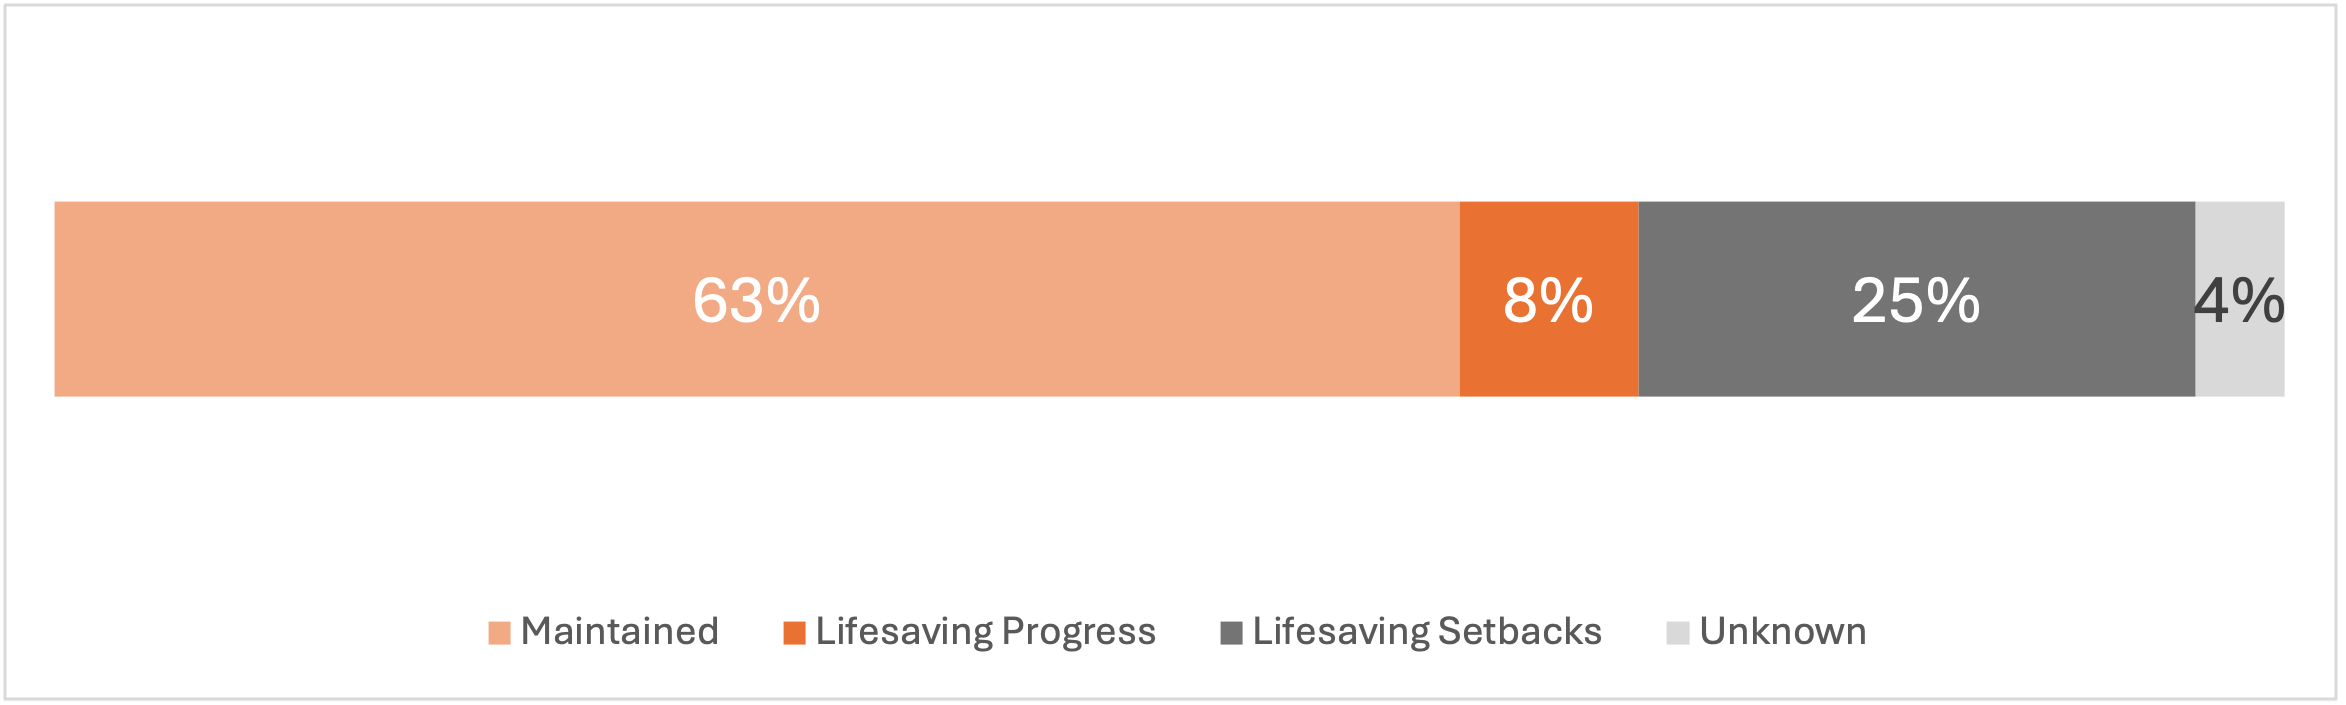
Despite the very real challenges facing most shelters in 2023, 63% maintained their 2022 lifesaving levels, while 8% saw lifesaving progress and 25% had lifesaving setbacks.
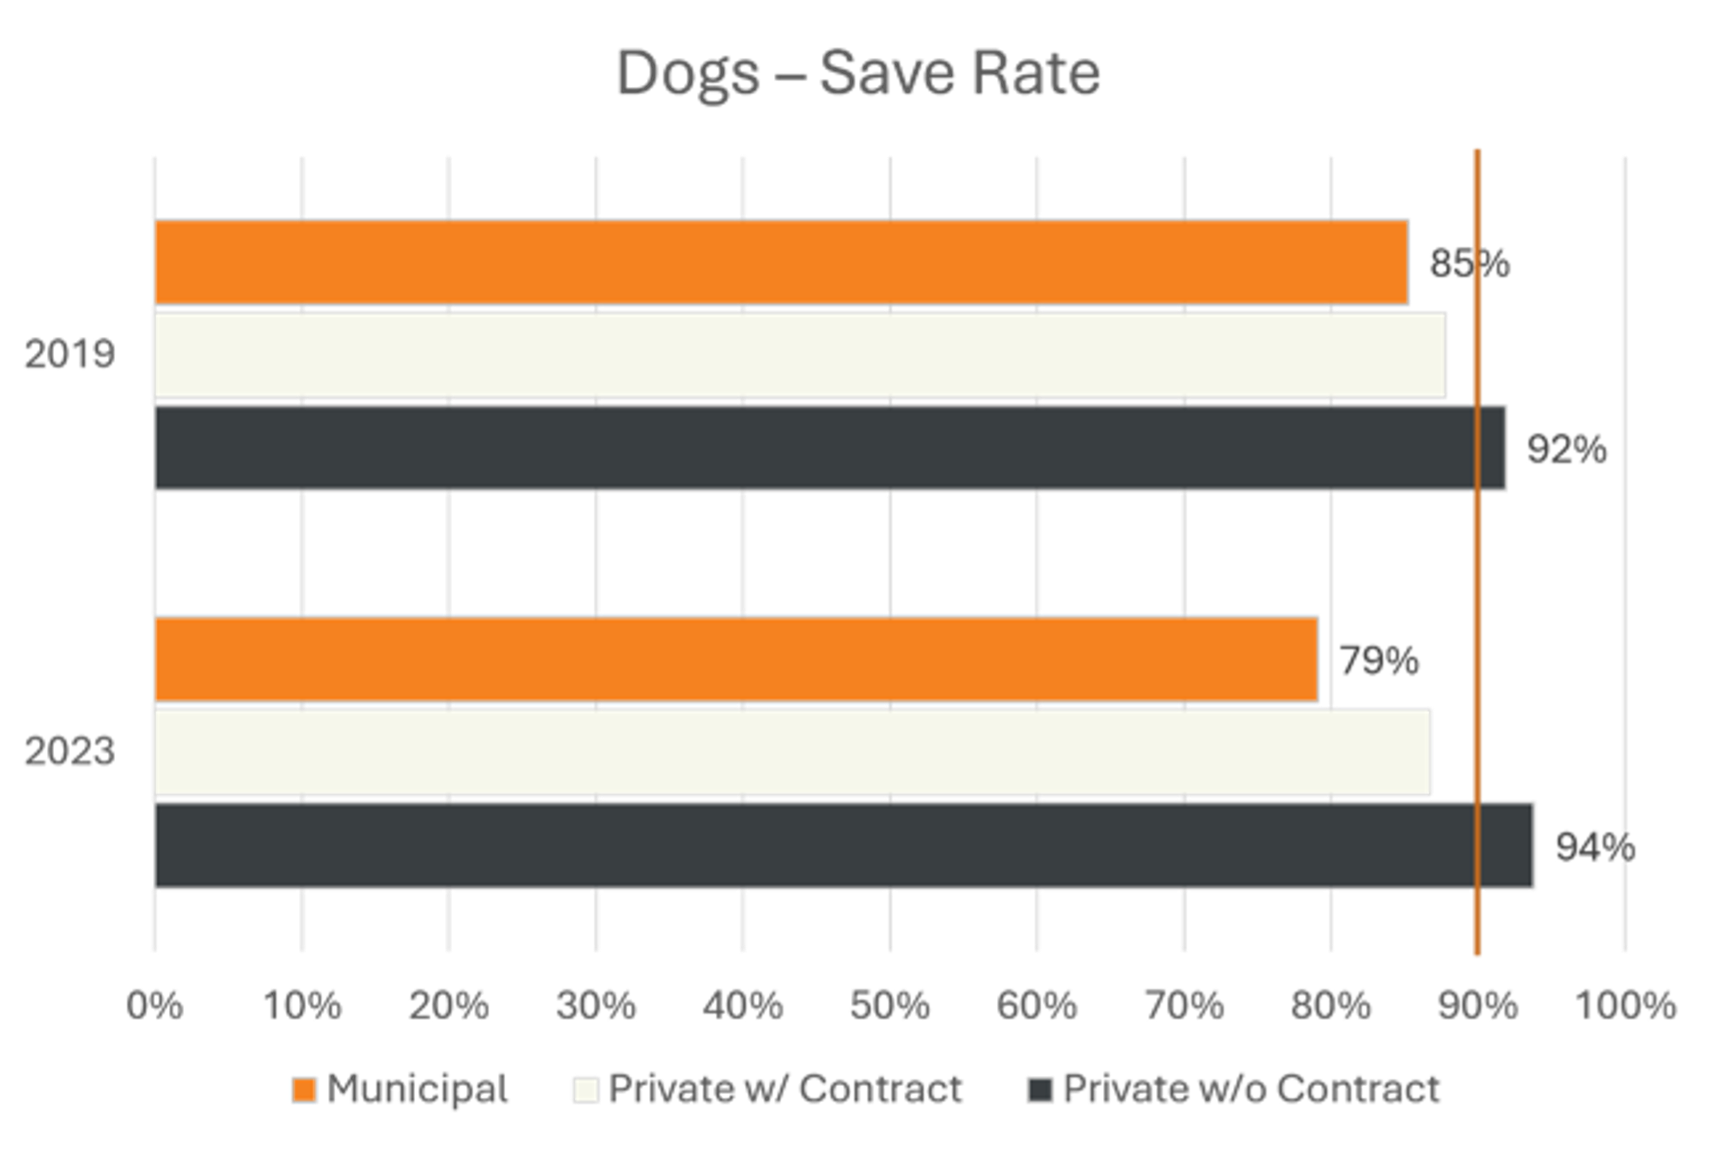
Nationally, municipal shelters are disproportionately shouldering the burden of the increases in dog intake and decreases in dog save rate. Between 2019 and 2023, municipal dog save rates decreased from 85% to 79%, while private shelters with government contracts remained largely consistent. Private shelters without government contracts improved their dog save rate from 92% to 94%.
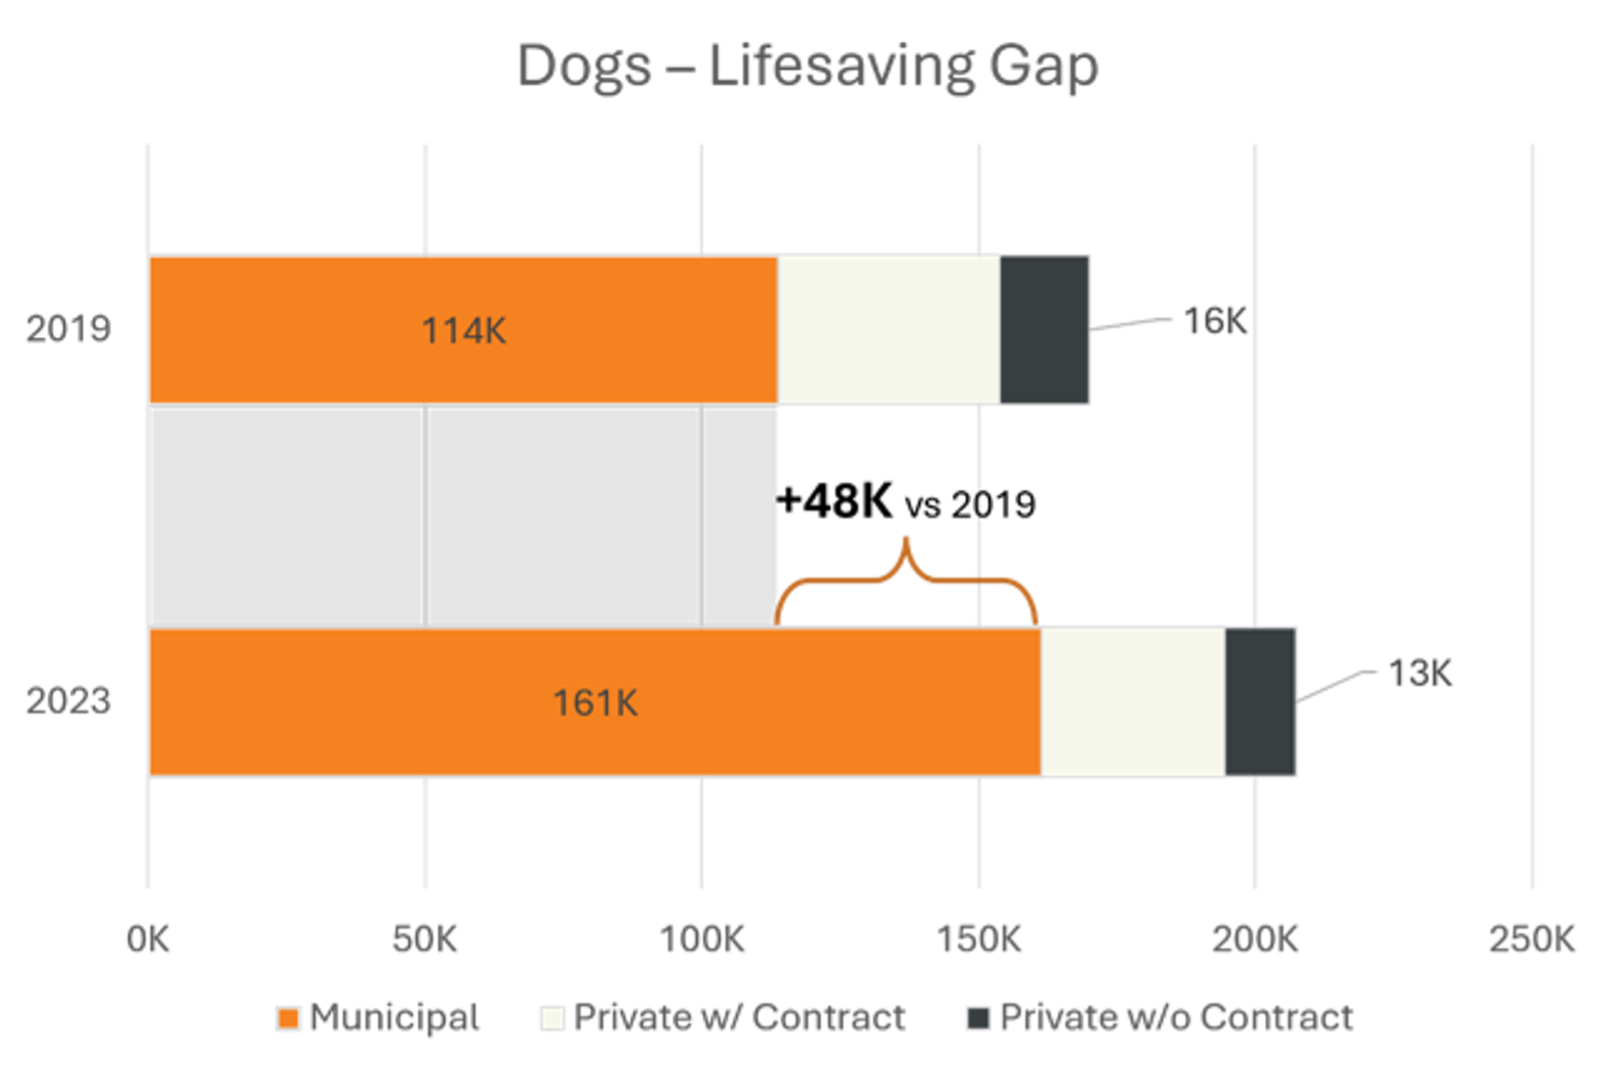
This disproportionate impact appears to be largely driven by a decrease in dogs transferred out of municipal shelters and into private shelters, specifically private shelters without government contracts. Between 2019 and 2023, private shelters without contracts decreased the number of dogs they transferred in by 64,000, which exceeds the municipals’ increased lifesaving gap of 48,000 during the same period by 16,000 dogs.
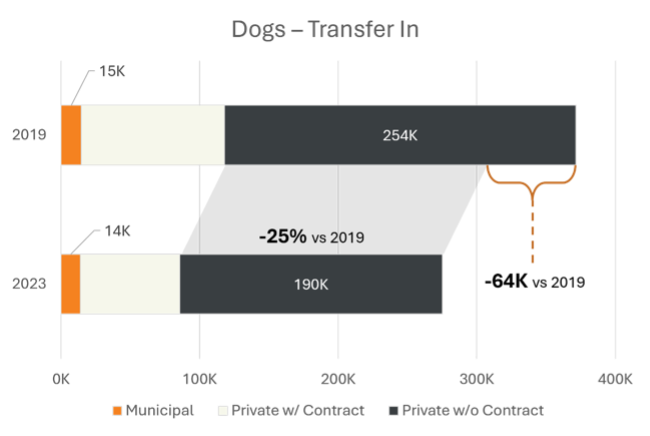
Additionally, dog adoptions from private shelters are down 26% (compared to a 17% reduction in municipal shelters and 9% reduction in private shelters with contracts), leading to capacity challenges and a decrease in transfers in from municipal shelters.
Overall, data shows that in 2023, transfers out of municipal shelters were down 17% compared to 2022. While the specific reasons for decreased transfer rates are not made clear by the current data, other industry trends are likely impacting these changes:
- Increase in Length of Stay: According to a sample of rescue groups and shelters using 24PetHealth, length of stay has increased by more than four days for dogs and two days for cats since 2021.
- Decrease in return-to-home (RTH/RTO) rates: municipal Return-to-home for dogs was down 26% in 2023 compared to in 2019.
What is the takeaway?
Now that we are well into 2024, it's clear we are experiencing the “new normal” for animal sheltering and that to close the lifesaving gap, we cannot continue to operate with the status quo. We must all examine our practices and our data to determine not only how we can improve our own organization’s lifesaving rates, but that of our wider communities.
There is hope.
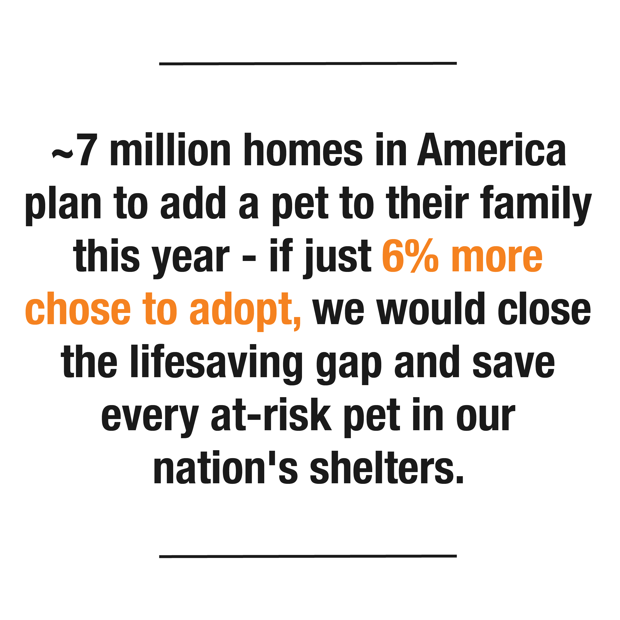
If we can convince 6% more families to adopt rather than purchase from breeders, we will be able to put an end to the killing of pets in shelters. To be successful in this effort, we must more effectively compete with highly resourced breeders and pet stores whose online shopping models promise pet acquisition is just one click away and whose savvy marketing practices have blurred the lines between adoption and purchase. Find out what you can do to make adoption your community’s first option when it comes to pet acquisition through your adoption process and marketing.
Doing so will require that we recognize that each potential adopter—if met with a negative experience—could turn to a breeder or a pet store. So, it’s important that we welcome adopters of all types with open arms by breaking down adoption barriers and embracing inclusivity.
We can no longer wait for the world to return to its pre-pandemic state, nor can we take a passive approach, blaming external forces for our challenges while neglecting to make internal changes to meet the needs of our new world. We can no longer maintain the status quo. We must take a deep, introspective look at our operations, assumptions, and our data, or we will fail to make the lifesaving progress we all strive to achieve.
Best Friends is here to help you navigate this ever-changing landscape. From 2022 to 2023, shelters that worked with Best Friends saw a 4.4% improvement in lifesaving compared to a 17.3% decrease in lifesaving for all other shelters for which we have data.
The next portion of this report is designed to help you take action and use your 2023 data to identify specific actions your organization can take to increase your lifesaving rates this year.
Part 2: Data in Action for Your Organization
To take advantage of this section of the report, you will need:
- Your 2023 save rate using the Best Friends Save Rate calculation (visit Shelter Pet Data Alliance to locate yours) to determine which category you fall into.
- To know how your save rate changed from 2022 to 2023 to determine which Progress subsection applies to you:
- Lifesaving Setback: your 2023 save rate decreased compared to 2022
- Lifesaving Improvement: your 2023 save rate increased compared to 2022
Using these two factors, locate which subsection applies to your shelter to see how your experience relates to the national trends for organizations in similar situations, see recommended areas of focus for 2024, and access resources to help you progress in your lifesaving.
Get our advice for your lifesaving setbacks or progress based on your 2023 data. Select the box for the category your organization falls into.
| 2023 Save rate is below than 80% | 2023 Save rate is between 80-89% | 2023 Save rate is 90%+ | |
| We experienced: | |||
| We experienced: | |||
| Lifesaving strategies for every organization | |||
Strategies Based on Your 2023 Data:
Organizations with a 2023 Save Rate Below 80%
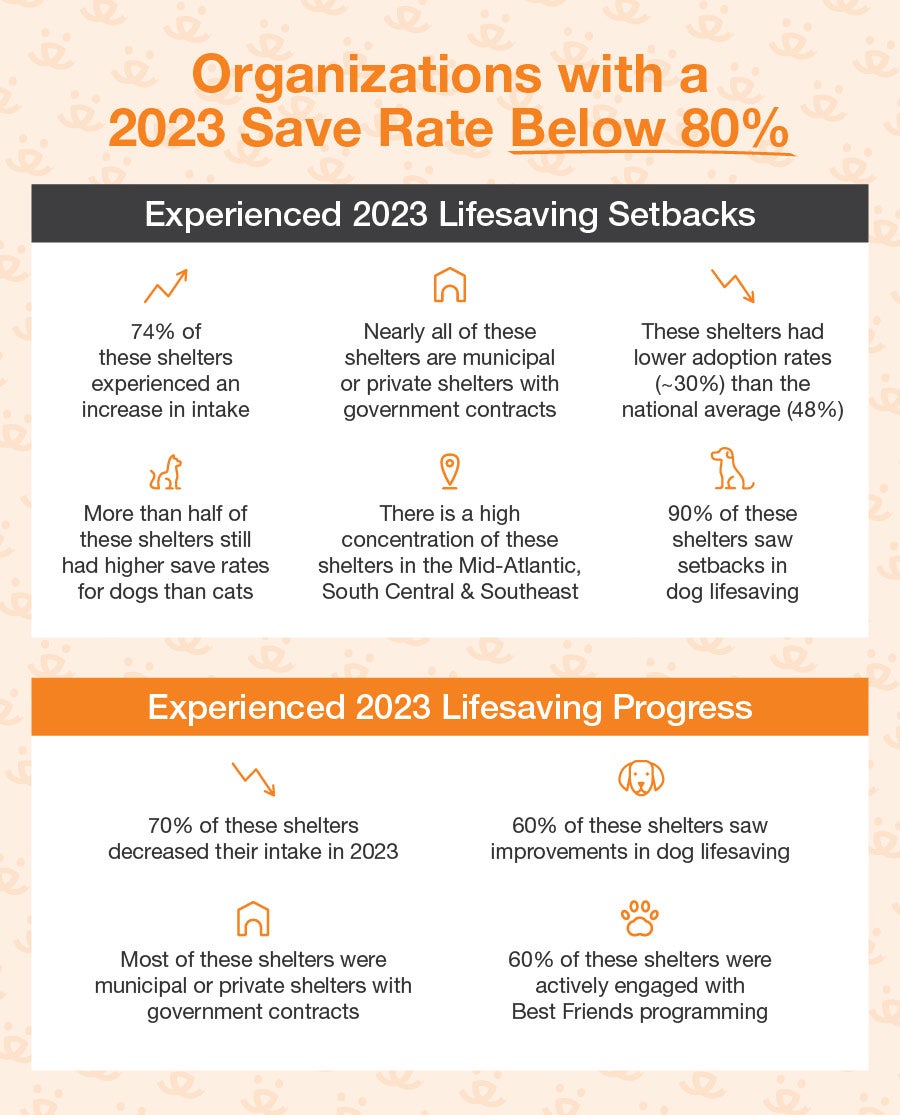
See trends about these groups>
We experienced lifesaving setbacks and had a save rate below 80% in 2023
Organizations that had a save rate below 80% and experienced setbacks from 2022 to 2023 experience significant challenges, but there are proven strategies to increase positive outcomes.
If you feel overwhelmed and don’t know which programs to focus on, start here:
For most organizations in this category, reducing intake and improving transfer partnerships are key strategies to increase lifesaving.
In addition to strategic managed intake resources recommended for all organizations, we recommend you use these key resources to grow your transfer program and make your pets appealing for transfer partners.
- This e-learning module is a valuable introduction to transport strategies: Lifesaving through Transport Programs
- Transport can be logistically complicated. Consider these tools to streamline transport planning.
- Effective marketing strategies can make your pets appealing to adopters and rescue partners alike.
- Some pet populations are harder to find rescue and adoptive placement for than others. Consider these resources to promote and find placement for those target populations.
Most organizations in this category need to see lifesaving improvements for both cats and dogs. For introductions to species-specific strategies, review these resources:
- Community Cat Programs Playbook
- Feline Housing and Enrichment Training Playbook
- Proven Lifesaving Strategies for Big Dogs Training Playbook
If fundraising is a major barrier to making these improvements, these resources can help you engage the community and raise more money.
We experienced lifesaving progress and had a save rate below 80% in 2023
Most organizations that had a save rate below 80% in 2023 but saw improvements compared to 2022 can use key 2023 successes as the foundations for increased lifesaving in the future.
For many organizations in the category, scaling up existing transport operations is key.
- Scaling up a transport program is logistically difficult, and often presents new challenges for your organization. Check out these best practices to help your transport program succeed as it grows.
- Consider these useful transport tools to make planning and logistics easier.
Organizations in this category may also benefit from returning to animal flow planning. While you’ve made important improvements in the last two years, there are likely programs that you could start for the first time or further streamline.
Now may also be a good time to scale up fundraising efforts by sharing your success stories and your future plans and needs. Consider these key fundraising resources:
Organizations with a 2023 Save Rate Between 80% and 89%
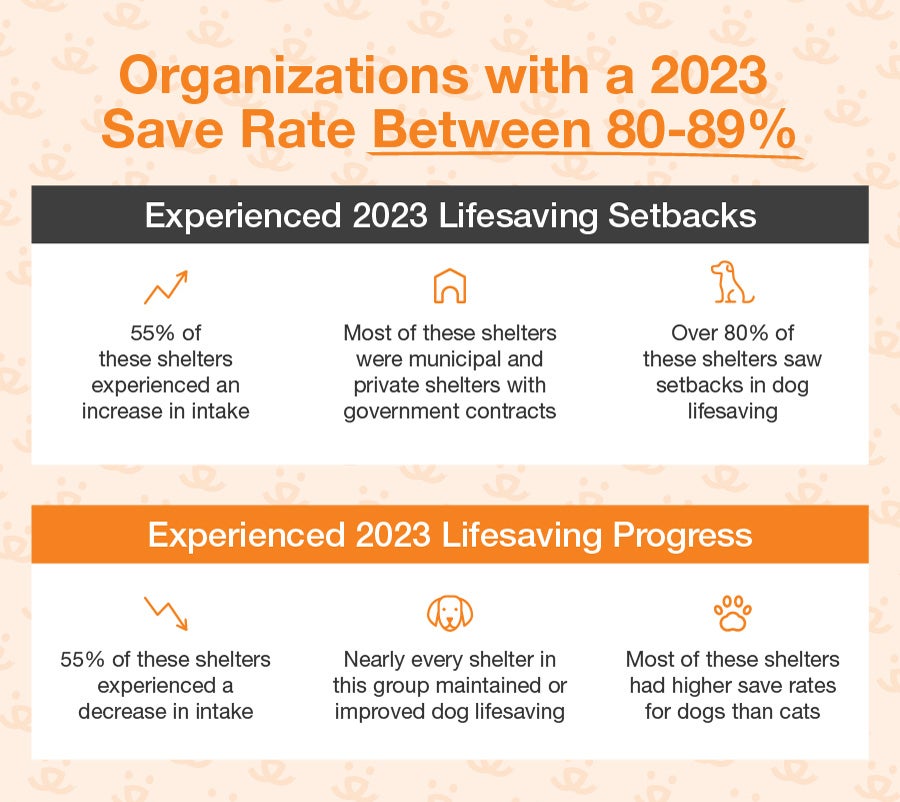
See trends about these groups>
We experienced lifesaving setbacks and had a save rate between 80% and 89% in 2023
For organizations who had a save rate between 80-89% in 2023 but saw setbacks compared to 2022, we recommend embracing strategic managed intake, streamlining existing programs, and piloting new initiatives.
In addition to the strategic managed intake strategies recommended for all organizations, consider these approaches to pet lifesaving and community engagement. What programs is your organization missing? What operations could be improved?
This introduction can help you determine which programmatic areas to focus on:
Once you’ve identified focus areas for your organization, look to these resources for more detailed advice.
- Foster Programs can increase your organization’s capacity for care while engaging the community.
- Open, accessible adoptions and transports are key, but sometimes thinking through alternative outcomes can help you save more pets.
- Reducing or waiving adoption fees while securing program-supporting funds through other means can also help you save more pets.
- Many organizations in this category saw increases in intake in 2023 compared to 2022. If that describes your agency, reviewing your Field-Training Programs can help animal control officers implement more proactive approaches and save more lives.
Most organizations in this category need to see lifesaving improvements for both cats and dogs. For introductions to species-specific strategies, review these resources:
- Community Cat Programs Playbook
- Feline Housing and Enrichment Training Playbook
- Proven Lifesaving Strategies for Big Dogs Training Playbook
We experienced lifesaving progress and had a save rate between 80% and 89% in 2023
Organizations with a save rate between 80-89% in 2023 who saw progress compared to 2022 can build on this positive momentum to save more lives in the future.
Just over half of organizations in this category saw reduced intake last year compared to 2022. If your organization didn’t see that reduced intake, learn from peer organizations’ success and revamp or pilot strategic managed intake.
Investing in your personnel can also help you scale programs, engage more community members, and save more pets.
We recommend that you review these resources to grow and retain your lifesaving community.
- Staff Development and Training
- Staff Recruitment and Retention
- Training New Animal Care Staff
- Volunteer Program Overview
- Foster Programs Training Playbook
Practicing open, accessible adoptions and community-engaged fundraising will further support your team’s success.
Organizations with a 2023 Save Rate Above 90%
See trends about these groups>
We maintained no-kill in 2023
For organizations with a save rate over 90%, reducing length of stay is a key strategy to increase capacity for care and facilitate increased transfers in.
Implement length of stay, animal flow, and daily rounds best practices to maintain no-kill status in the future.
Practicing open, accessible adoptions is important for all organizations, but shelters and rescues with high save rates often have the resources to pilot innovative community engagement programs to drive even more adoptions.
- Try reduced or fee-waived adoptions:
- Learn how to pilot new initiatives and get stakeholder buy-in from experts on this topic
- Champion open, accessible adoptions:
For organizations that have maintained no-kill status, consider how your organization can model best practices and support other animal welfare organizations that are struggling.
Connect with organizations with lower save rates, especially municipal and government contract shelters, to transfer in pets:
- This e-learning module is a valuable introduction to transport strategies: Lifesaving through Transport Programs
- Partner with other organizations to practice efficient, healthy transports using these best practices:
- Transport can be logistically complicated. Consider these tools to streamline transport planning.
We experienced lifesaving progress to 90% and are newly no-kill
For the newly no-kill, congratulations! We recommend that you build on your success by growing your lifesaving community and planning for future challenges.
Strategies for Everyone: How to Increase Adoptions and Address Capacity Challenges
Adoption rates are impacted by a complex variety of social, generational, and economic factors, so simply returning to our pre-pandemic adoption rates is easier said than done. Best Friends is conducting research to gain further insight into these factors, but our industry surveys indicate several ways organizations can make positive progress.
1. Diversified Marketing Practices and Increased Awareness of the Problem and Solutions:
To increase the number of animals leaving with a positive outcome, we must first get people in the door. Diversified marketing practices will help increase awareness of the lifesaving gap faced in your own community, however, in an age where community members often feel overwhelmed and bombarded with “problems” and “bad news”, it is important to focus on the positive, actionable ways the community can help.
Additionally, as savvy breeders increasingly appropriate the term “adoption” to replace “purchase” in their messaging, it is important to ensure your community understands that true adoption only occurs from a shelter or non-profit rescue group. For more information on how to increase awareness in your community, review this Program Spotlight.
Surveys of Best Friends Network Partners indicate that most shelters and rescue groups rely on social media as their primary, or only, marketing vehicle. When employing a social media marketing strategy, diversification is key. Facebook user demographics increasingly skew toward Baby Boomers and GenXers, while Millennials and GenZers are increasingly moving to platforms like Instagram and TikTok.
However, data from the research conducted by the American Pet Products Association on pet acquisition in 2023–2024 suggests that our industry’s extreme social media focus may be problematic.
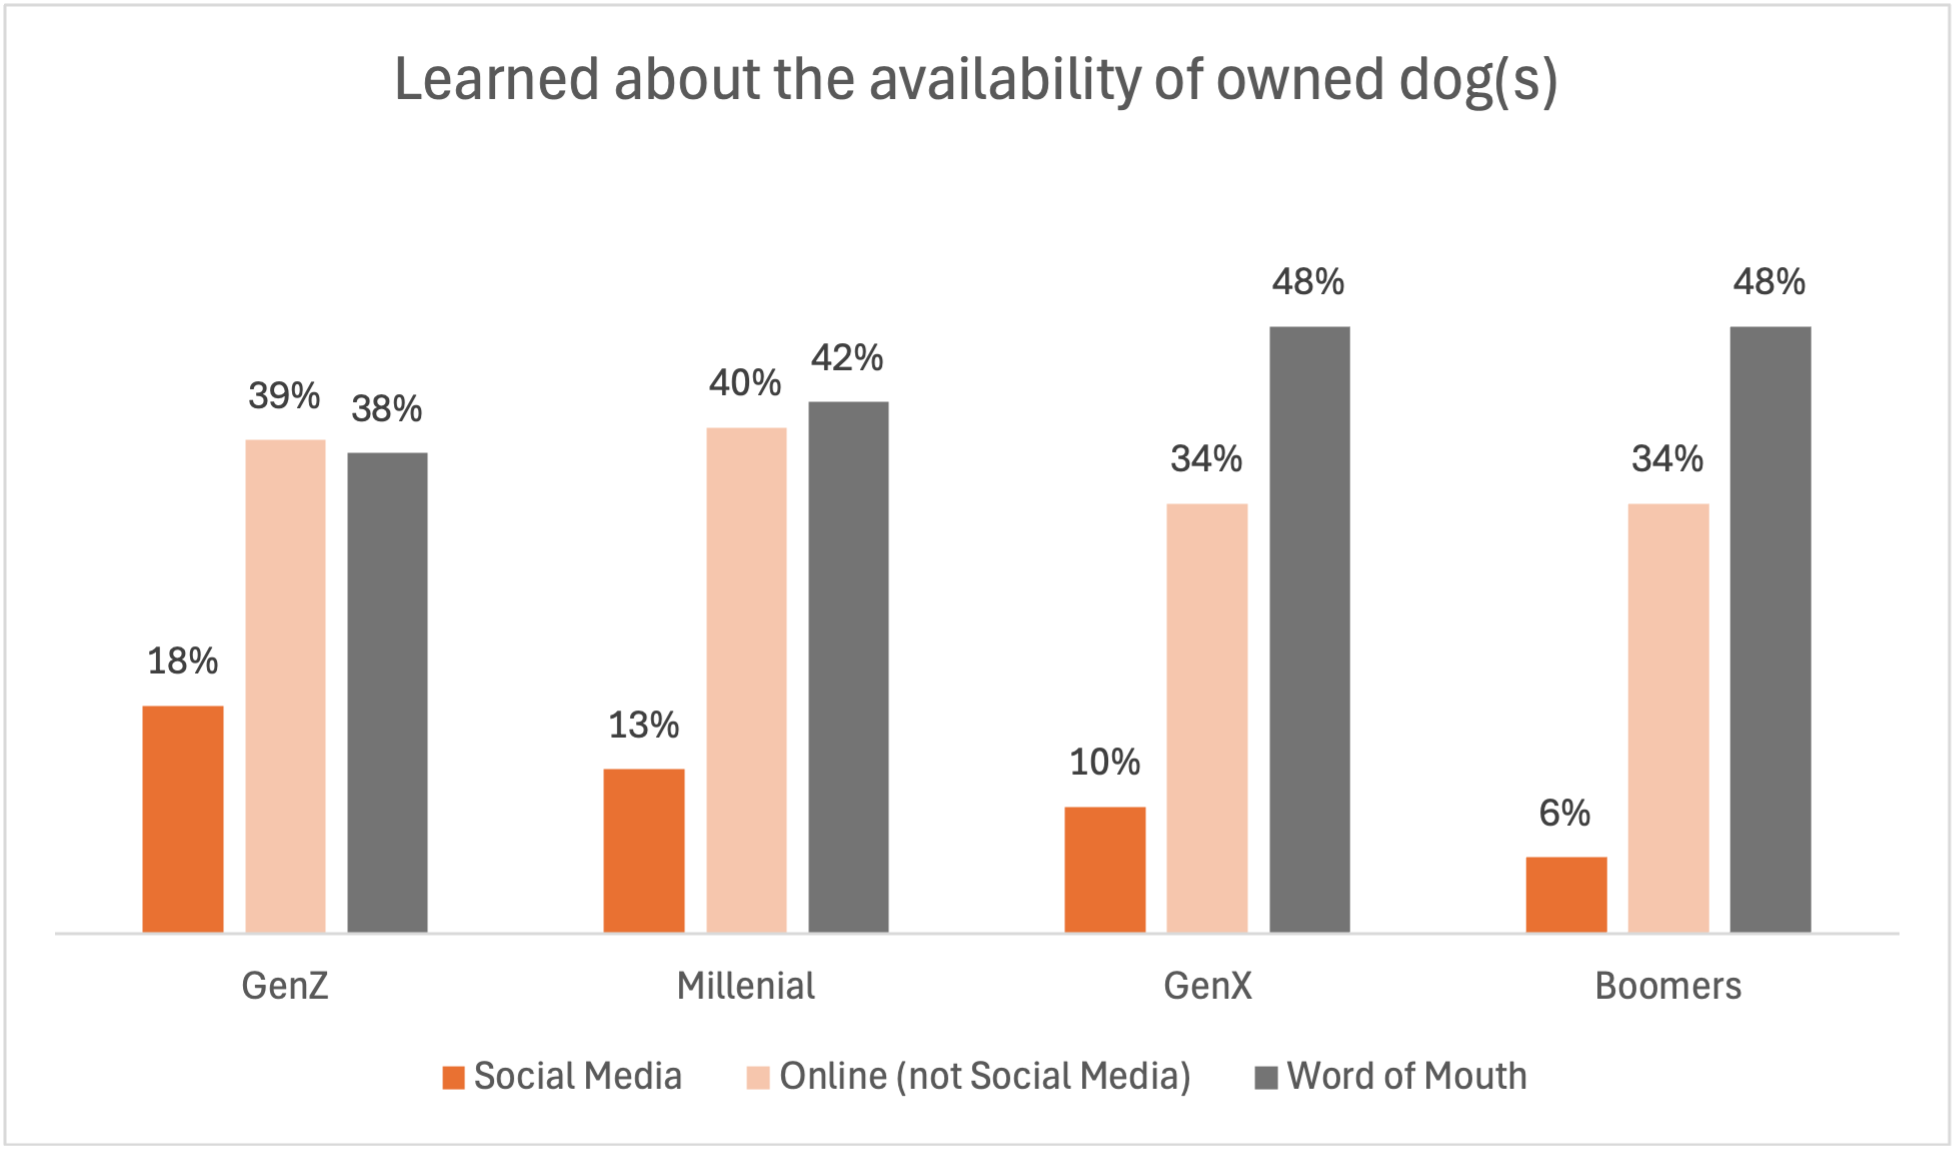
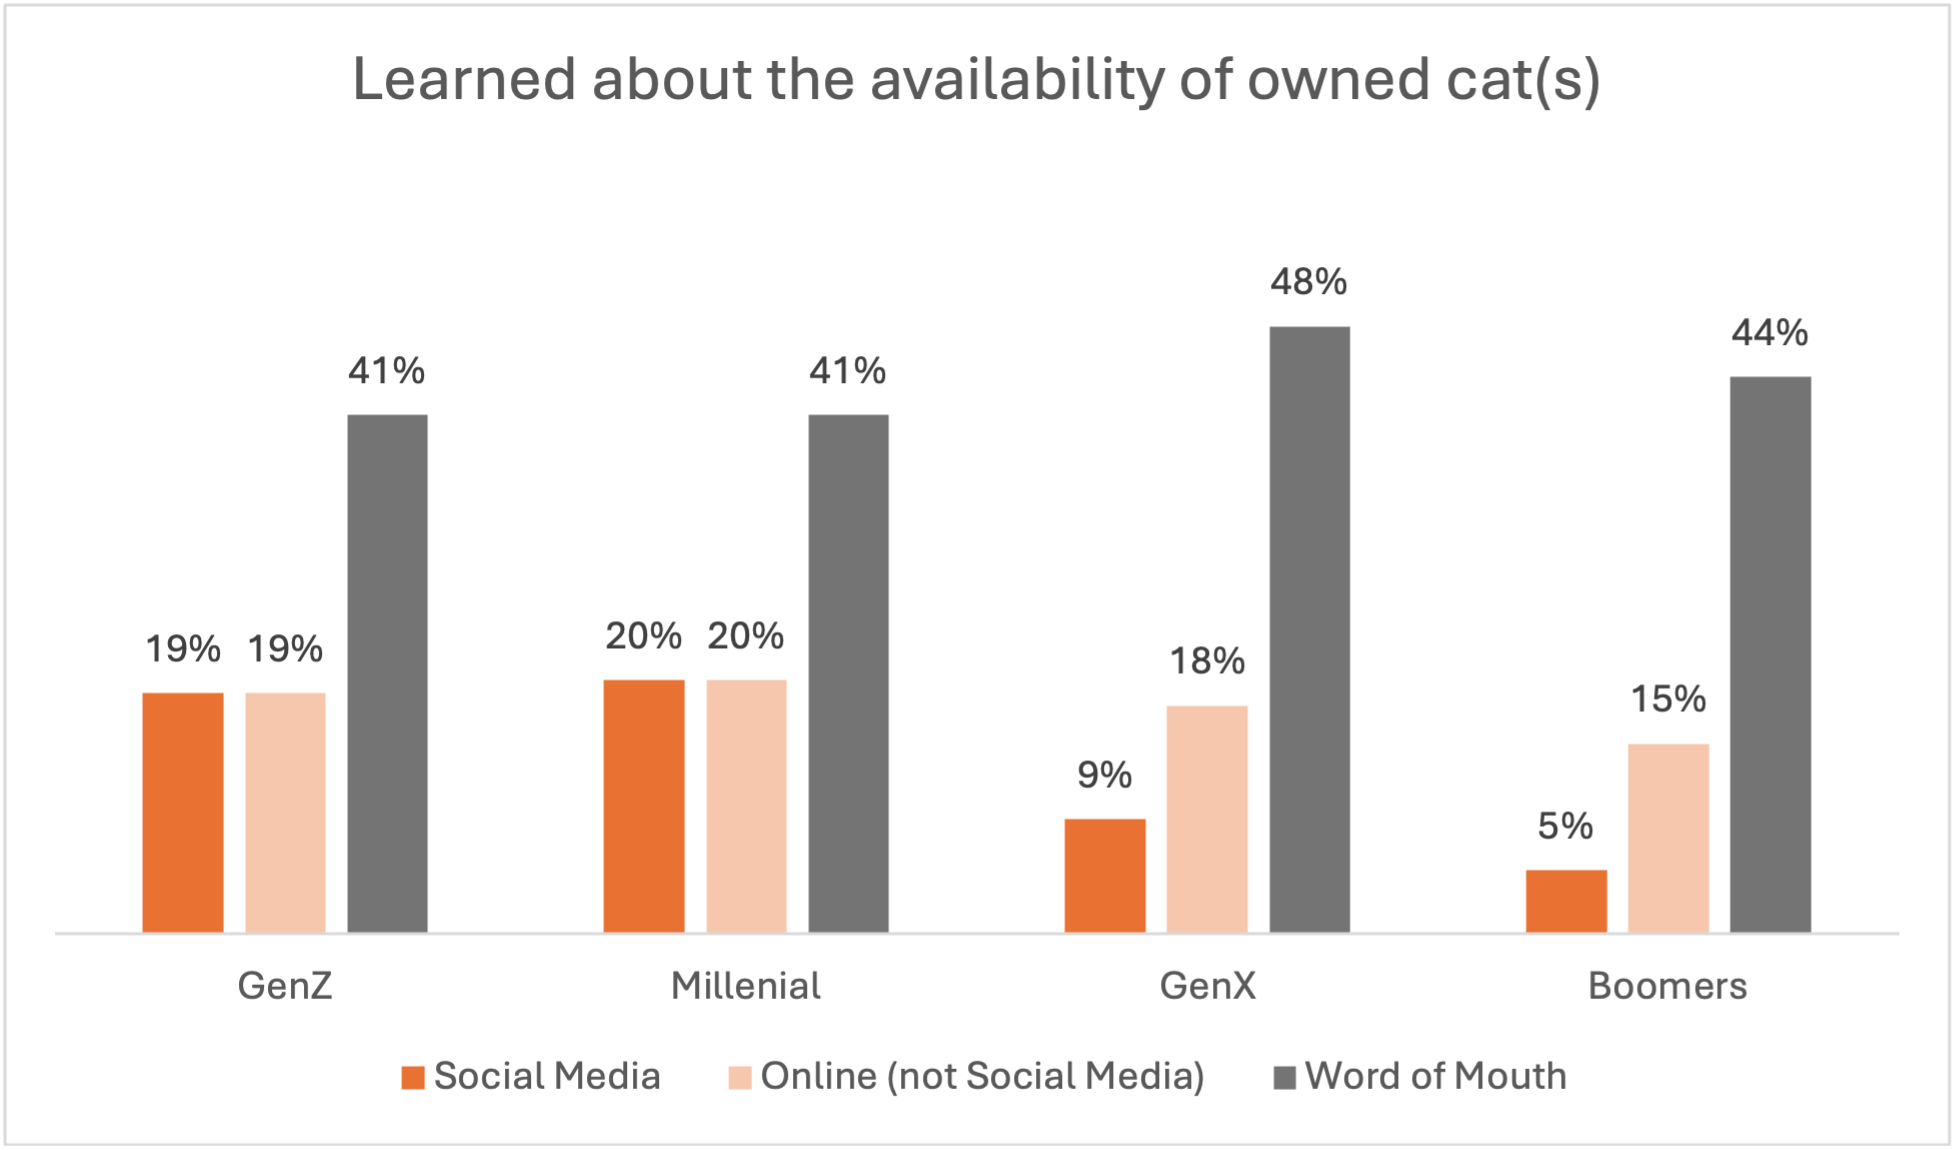
Though younger generations showed a higher rate of learning about their pet through social media, it was not the leading method for any generation, topping out at 19% for GenZ dog owners and 25% for Millennial cat owners. However, it’s unclear if this data indicates if social media is less effective in driving pet adoption than previously believed or if pet adoption organizations are not keeping up with best practices as they evolve.
Many pet owners are learning about the availability of the pet that they ended up acquiring through other online sources such as Petfinder, Adopt-a-Pet, and breeder websites. Making sure all your adoptable pets are available online through a pet adoption platform with attractive, engaging photos can help get your adoptables the exposure they need to find loving homes.
Across all generations and pet types, with the exception of GenZ dog owners, word-of-mouth was still the leading method for owners to hear about their pets’ availability. This suggests that animal organizations should increasingly invest in marketing tactics that encourage, and even incentivize, word-of-mouth sharing, including a diversified social media strategy and public relations tactics.
 *Note for respondents who owned multiple dogs/cats, multiple values could be selected.
By leveraging a variety of marketing platforms and tactics beyond social media, shelters and rescue groups can reach a larger and more diverse group of potential adopters and more effectively compete with marketing savvy breeders and puppy stores. For more information on how and why to diversify your marketing practices, visit our Marketing & Communications guide.
2. Open Adoptions:
In shelters and rescue groups, we often feel that it is our ultimate responsibility to ensure the care of our animals even after they leave our facilities. This ongoing commitment often leads to agencies searching for the “perfect” adopter and implementing practices or philosophies that “weed out” those who don’t fit our criteria of perfection. But what is “perfect” or even “good enough”? And how many prospective adopters purchase animals simply because they don’t fit our notions of an ideal home?
It’s a great question and one that has years of research behind it. Studies have been conducted looking at everything from retention rates to lifetime care provided, veterinary or other, for adopted animals in different types of homes (surveying people with different socioeconomic status, those with children, single adults vs. married couples, those with other pets and those without). With all this research, one clear conclusion is that our fears about adopters are usually unfounded. Consequently, many agencies are finding that in the search for perfect homes, they are missing out on lifesaving opportunities.
Adoption barriers can take many shapes, from high adoption fees, long or intrusive adoption applications, lack of accommodations for non-English speakers, home or landlord checks, or limited open hours for the public (particularly limited hours outside of the traditional workday).
Increasing adoption rates is imperative to decreasing killed rates, and yet our 2023 Network Partner Survey indicates that 74% of shelters and 92% of rescue organizations are not following open adoptions best practices. To gain further insight into this important topic, the Best Friends Network conducted a focused Open Adoption Practices survey in Spring 2024, and found that:
Only 36%
of organizations conduct
same day adoption
Only 37%
of organizations with a building
have open hours after 5pm on weekdays
Only 15%
of organizations have
bi-lingual adoption applications available
72%
of groups conduct either
landlord calls or home and yard inspections
68%
of groups call veterinary references
While most of the barriers we put in place are well-intentioned, their implications are wide reaching. As an industry, we must stop “saving” pets to death. Please use our open adoptions self-assessment to determine how your practices compare to recommended open adoption best practices. For more information on open adoptions practices, review our Open Adoptions Playbook as well as the materials coordinated for our Bring Love Home Open Adoptions Challenge, including practical tips to implement lifesaving changes and guides to marketing your updated practices to your community.
3. Strategic Managed Intake
Strategic managed intake programs are rooted in the understanding of two key realities:
- For most animals, being taken to and housed in an animal shelter can be stressful, and subject those animals to illness, stress and eventually, euthanasia.
- All shelters have finite resources that should be strategically used for the greatest benefit to the community. In many communities, shelter staff struggle to provide adequate care to animals when there is not a thoughtful, strategic plan for intakes, resulting in crowding and increased illness as well as staff burnout and turnover.
Due to these realities, it’s often not in the best interests of the animals, shelter’s staff, its budget, and other resources, for animals to enter without a triage process — often described as strategic managed intake.
Learn more about strategic managed intake and community services.
At their core, strategic managed intake programs provide options for animals to be kept in their homes, returned to their homes, or find them new homes, without having to enter the shelter at all. It’s a win-win for everyone.
It’s important to note that for some animals, immediate entry to the shelter is the best solution for them. These cases might include injury or illness, the animal is a risk to the public, or if the animal is in immediate or eminent danger. In those cases, the shelter should take in those triage cases immediately. By deferring other animals through strategic managed intake programs, they will be better resourced to take in these triage cases.
The responsible use of strategic managed intake practices can reduce the number of animals entering shelters by prioritizing animals based on need and empowering the community with resources to rehome and reunite pets on their own. Strategic managed intake is often misunderstood or improperly implemented, leading to incorrect perceptions that this strategy results in high need animals being turned away, animals being left to freely roam the streets, and desperate community members being denied shelter services.
To learn more about appropriate strategic managed intake practices, please review our editorial, Setting the Record Straight on Managed Intake.
4. Empowering Your Community
You can’t solve all the challenges facing animal shelters and rescue groups on your own. Communities that have successfully closed their lifesaving gaps have overwhelmingly done so by including their community in the solution. Empowering your community to support your lifesaving efforts requires transparency about the specific struggles you’re facing and detailed information about the ways they can help you overcome those hurdles.
To learn more about how you can invite your community in and get their help in increasing lifesaving, visit our Engage Your Community with Grassroots Marketing.
Now what?
To succeed in increasing lifesaving in 2024, we must all:
Work together and support each other
Reduce barriers to adoption to better compete with breeders
Increase transfers from municipal shelters as well as return-to-home (RTH/RTO) and trap-neuter-vaccinate-return (TNVR) practices
Track your organization’s improvements and setbacks monthly using SPDA
Part 3: 2024 So Far
Best Friends’ data scientists have identified the following trends in January through March, 2024.
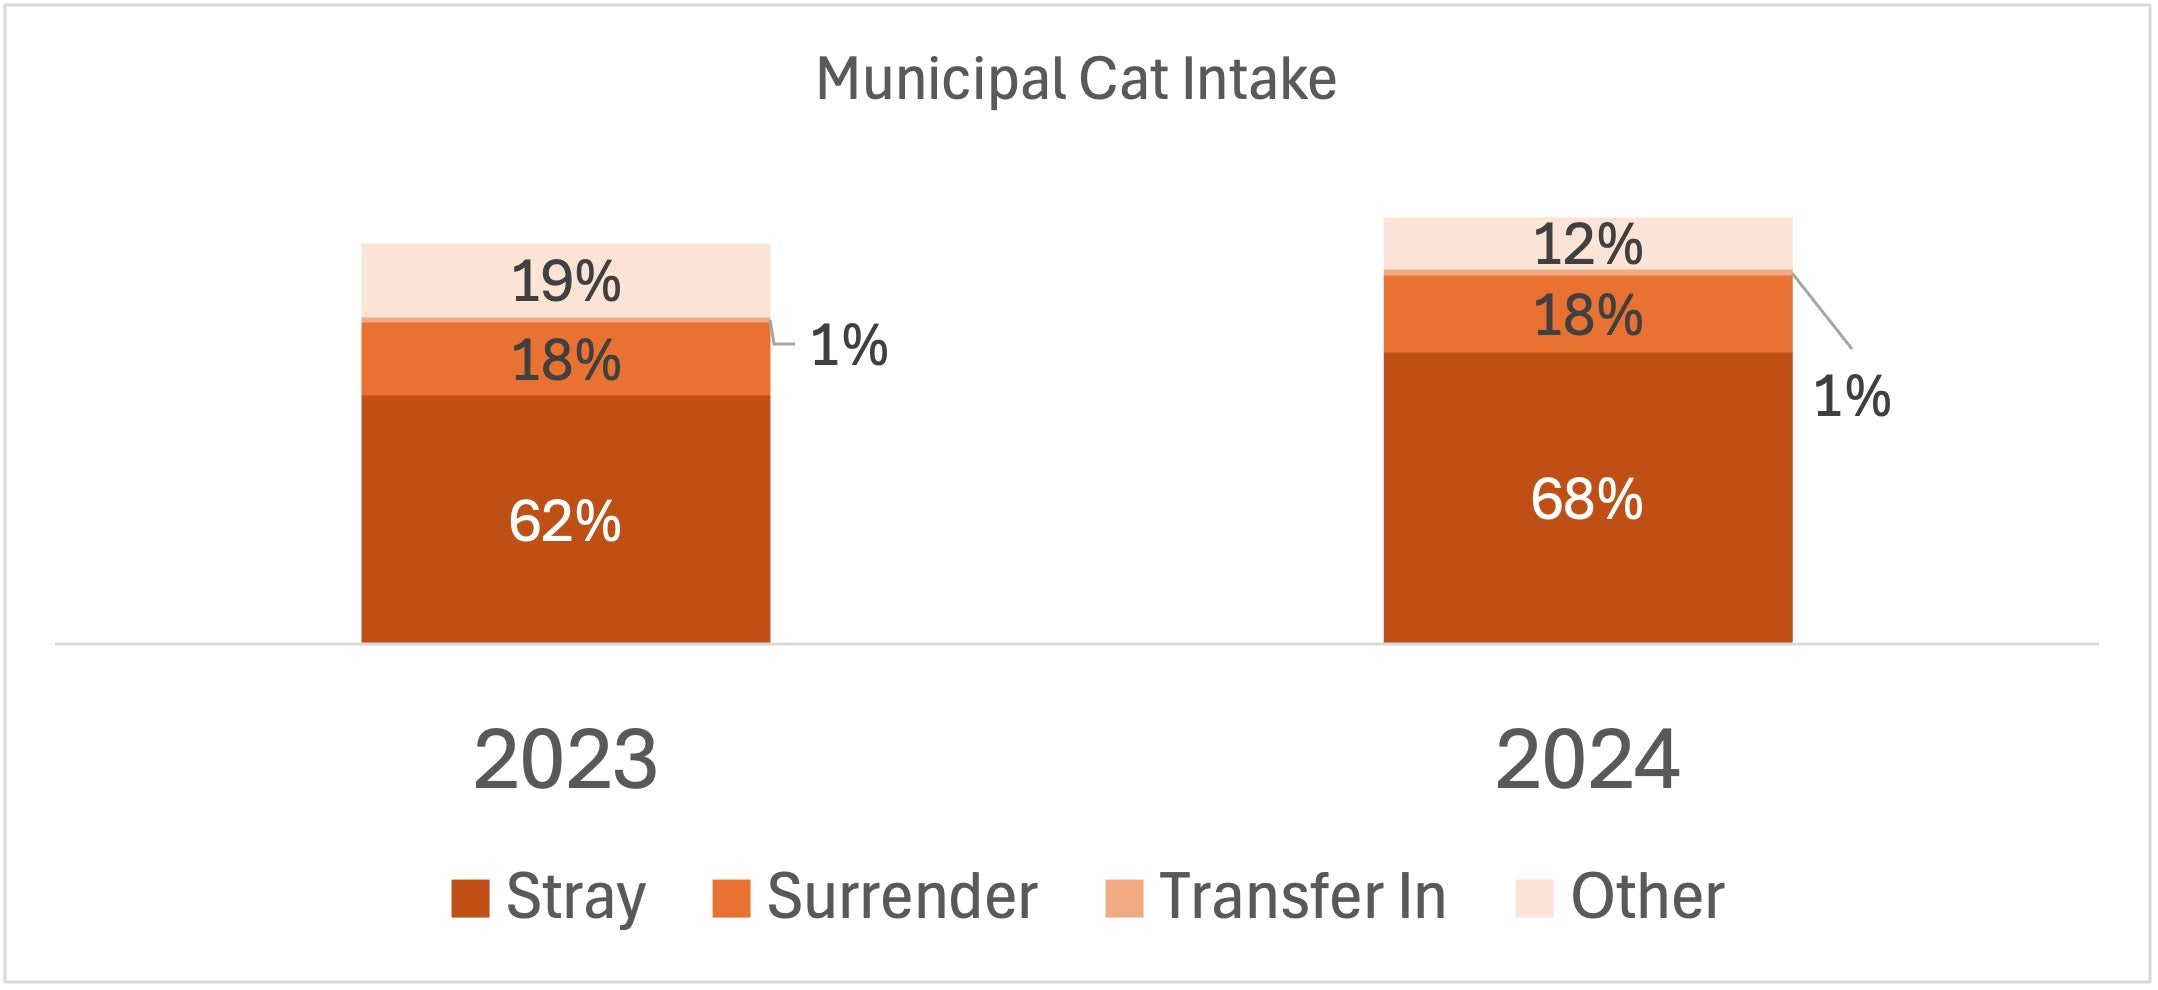
Both stray intake and owner surrenders for dogs and cats are on the rise so far this year. For municipal shelters specifically, cat intake is up 6.6% and dog intake is up 4.0%.
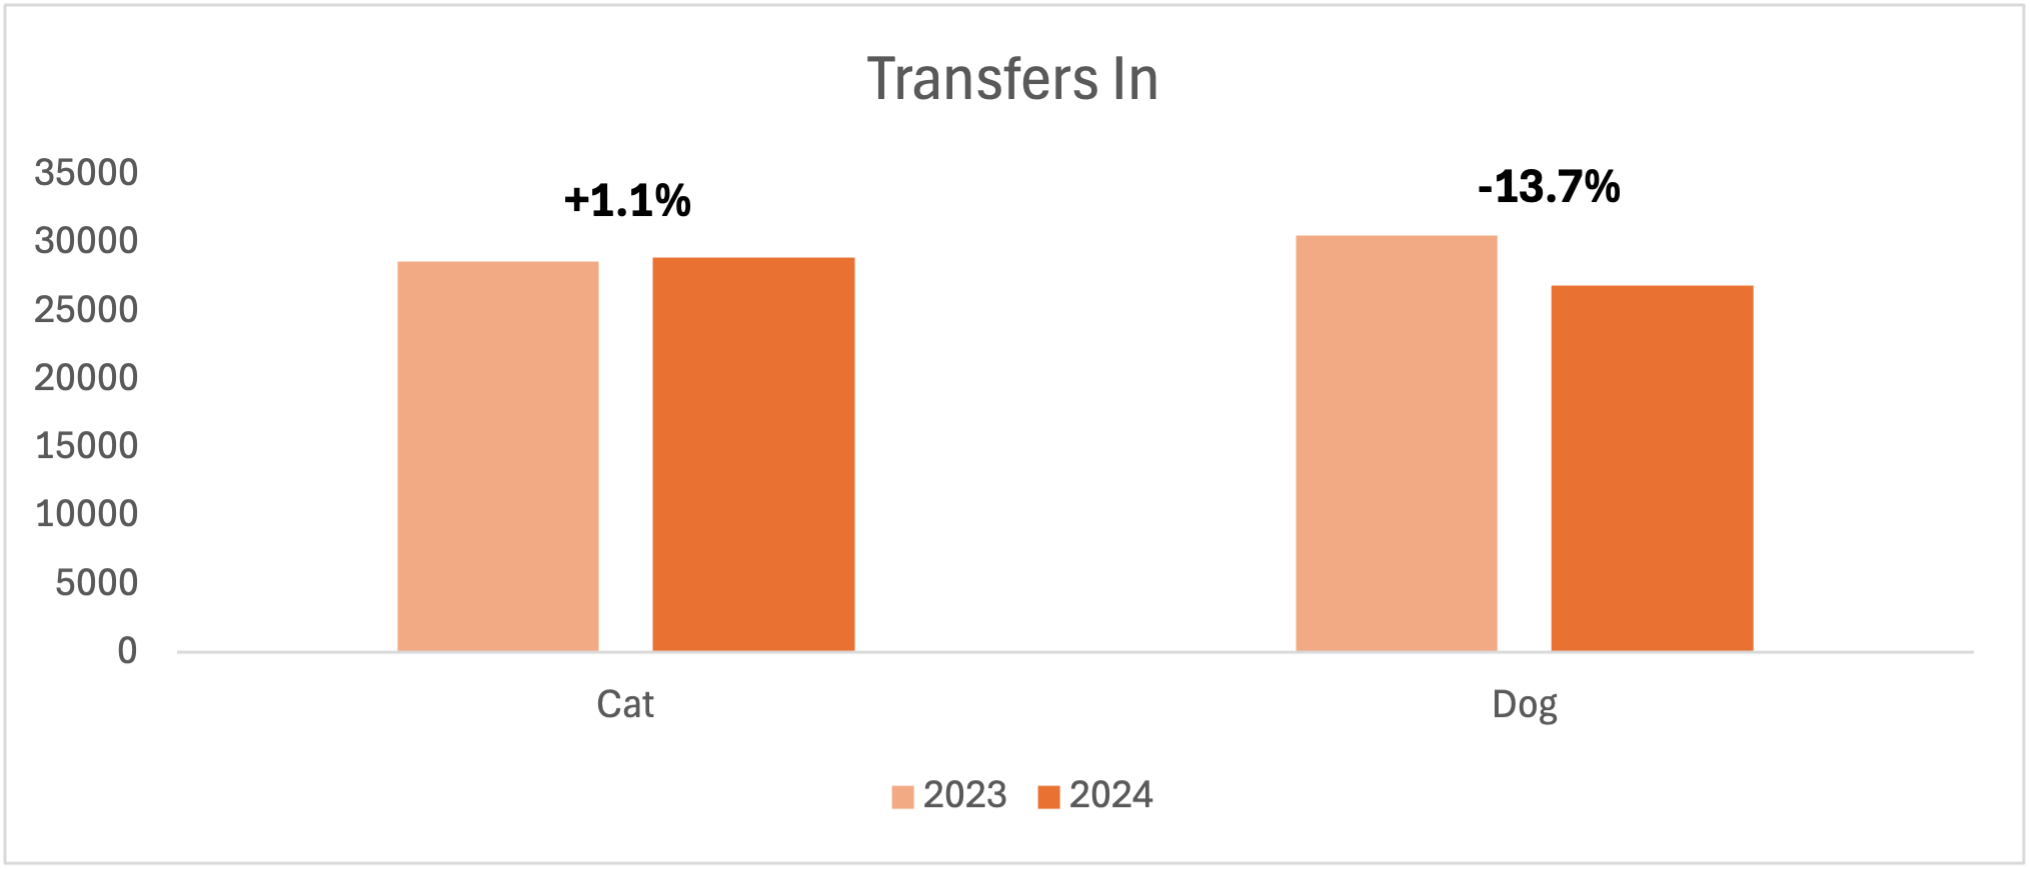
While cat transfers in have increased slightly compared to the same period in 2023 for all types of shelters, dog transfers in have further declined, which threatens to increase the burden on municipal shelters.
Dog intake at private shelters without contracts was down 13.5% since 2023.
- Transfers-in still make up the largest proportion of cat intake in private-without-contract organizations, and transfers-in were up 1% compared to 2023, which results in a substantial volume decrease of transfers-in.
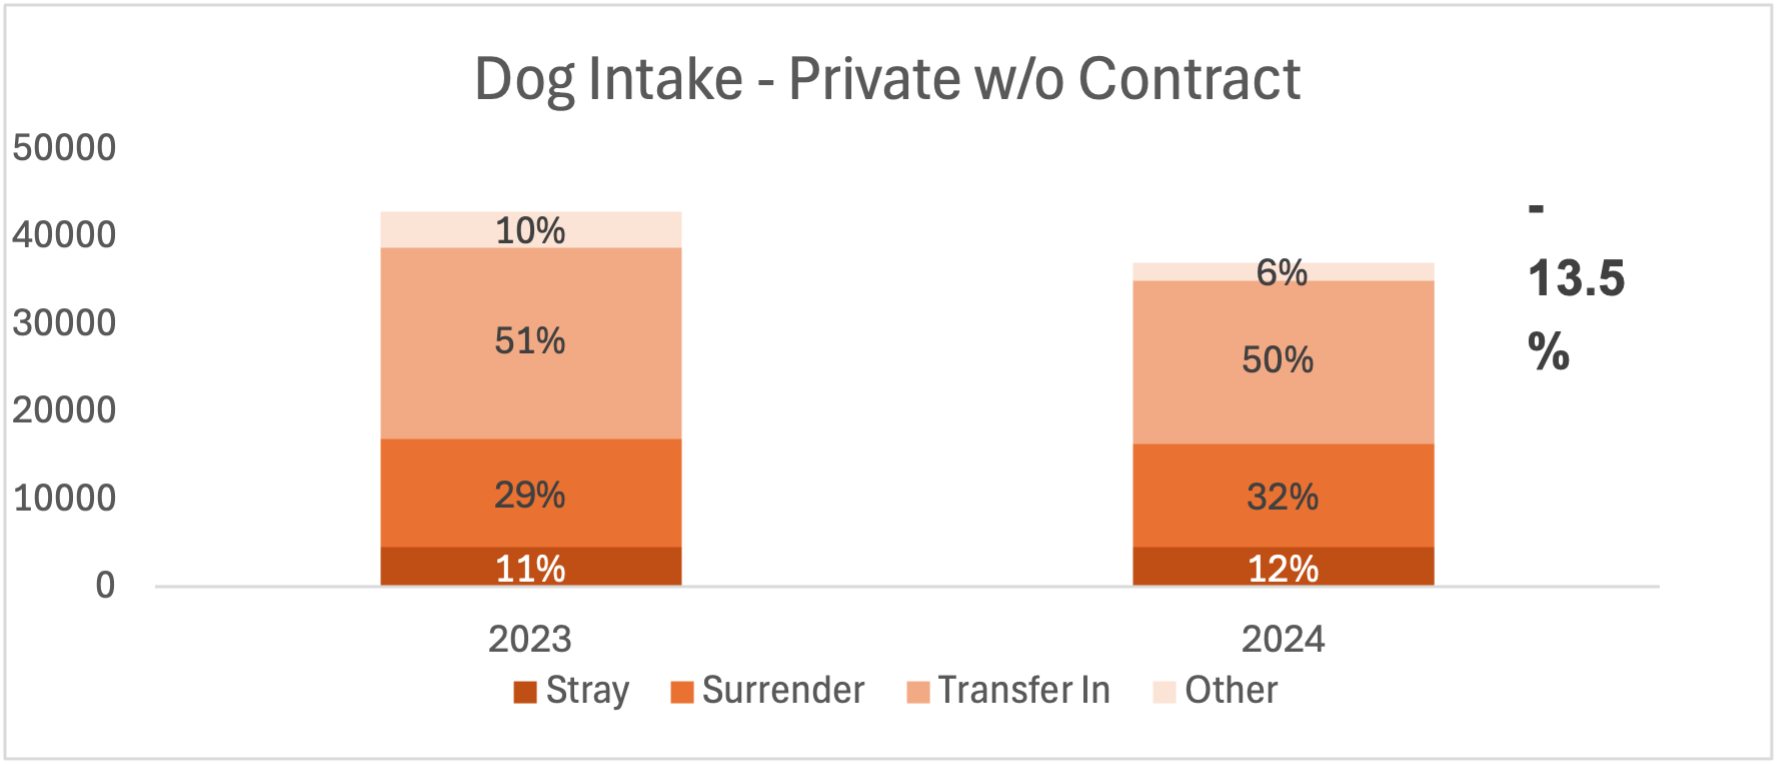
Cat intake at private shelters without contracts is up 0.7% from 2023. Transfers-in still make up the largest proportion of cat intake in private-without-contract organizations, and transfers-in were up 1% t compared to 2023. Overall, the intake patterns for cats remain largely unchanged from 2023.
OUTCOMES
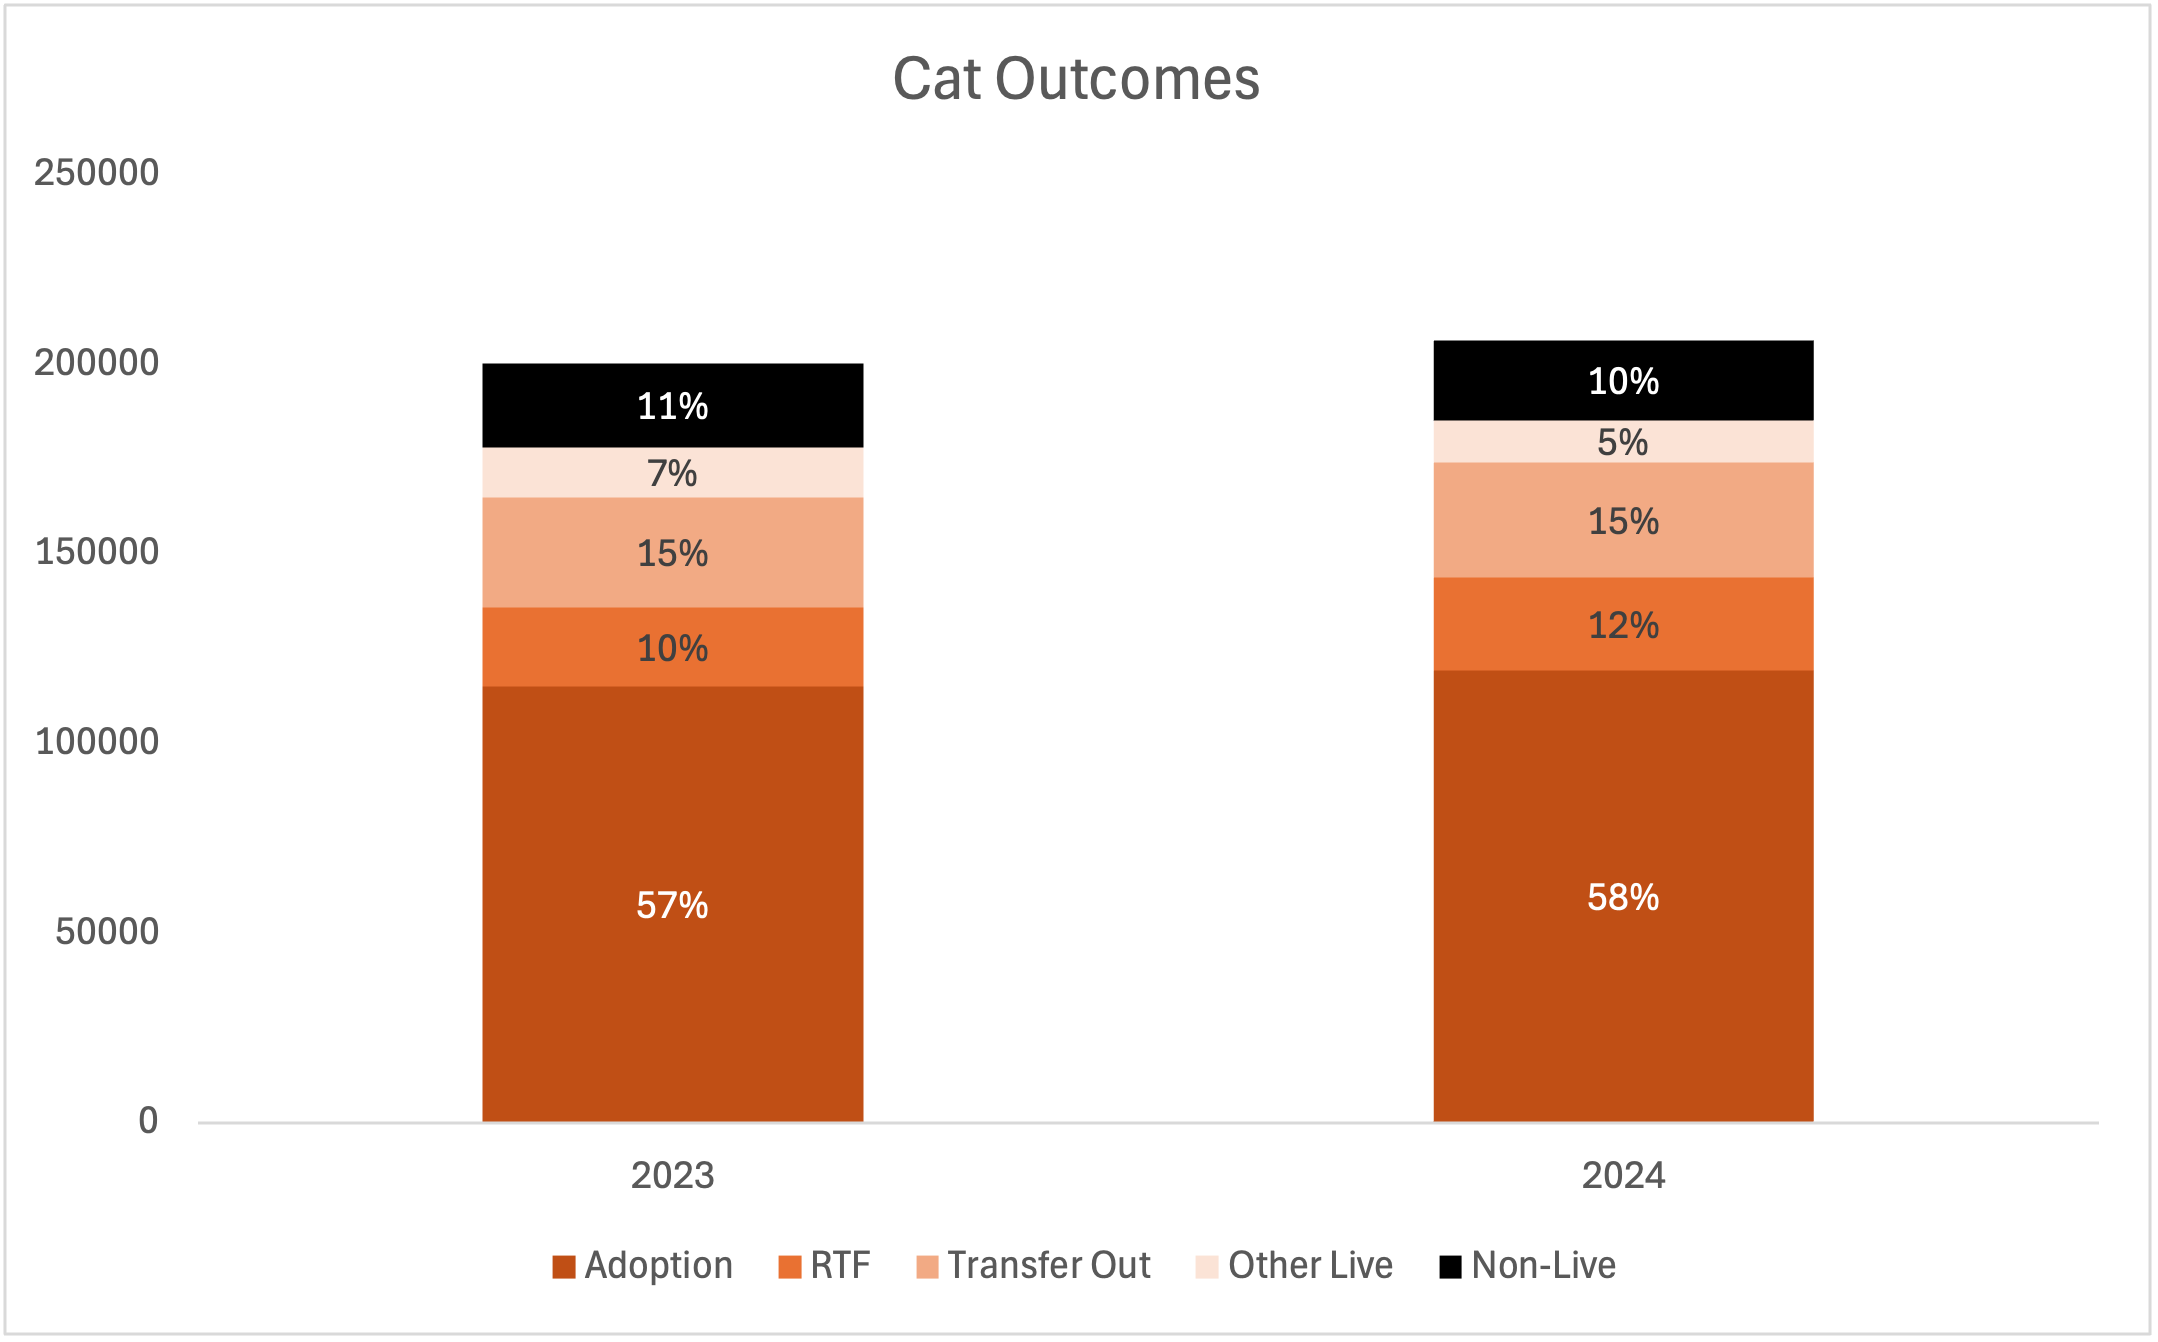
Generally, cat outcomes in the first quarter of 2024 are similar to those observed in the same period in 2023. Adoptions are up 1% and returns-to-field are up 2% over 2023, with non-live outcomes falling by 1%.
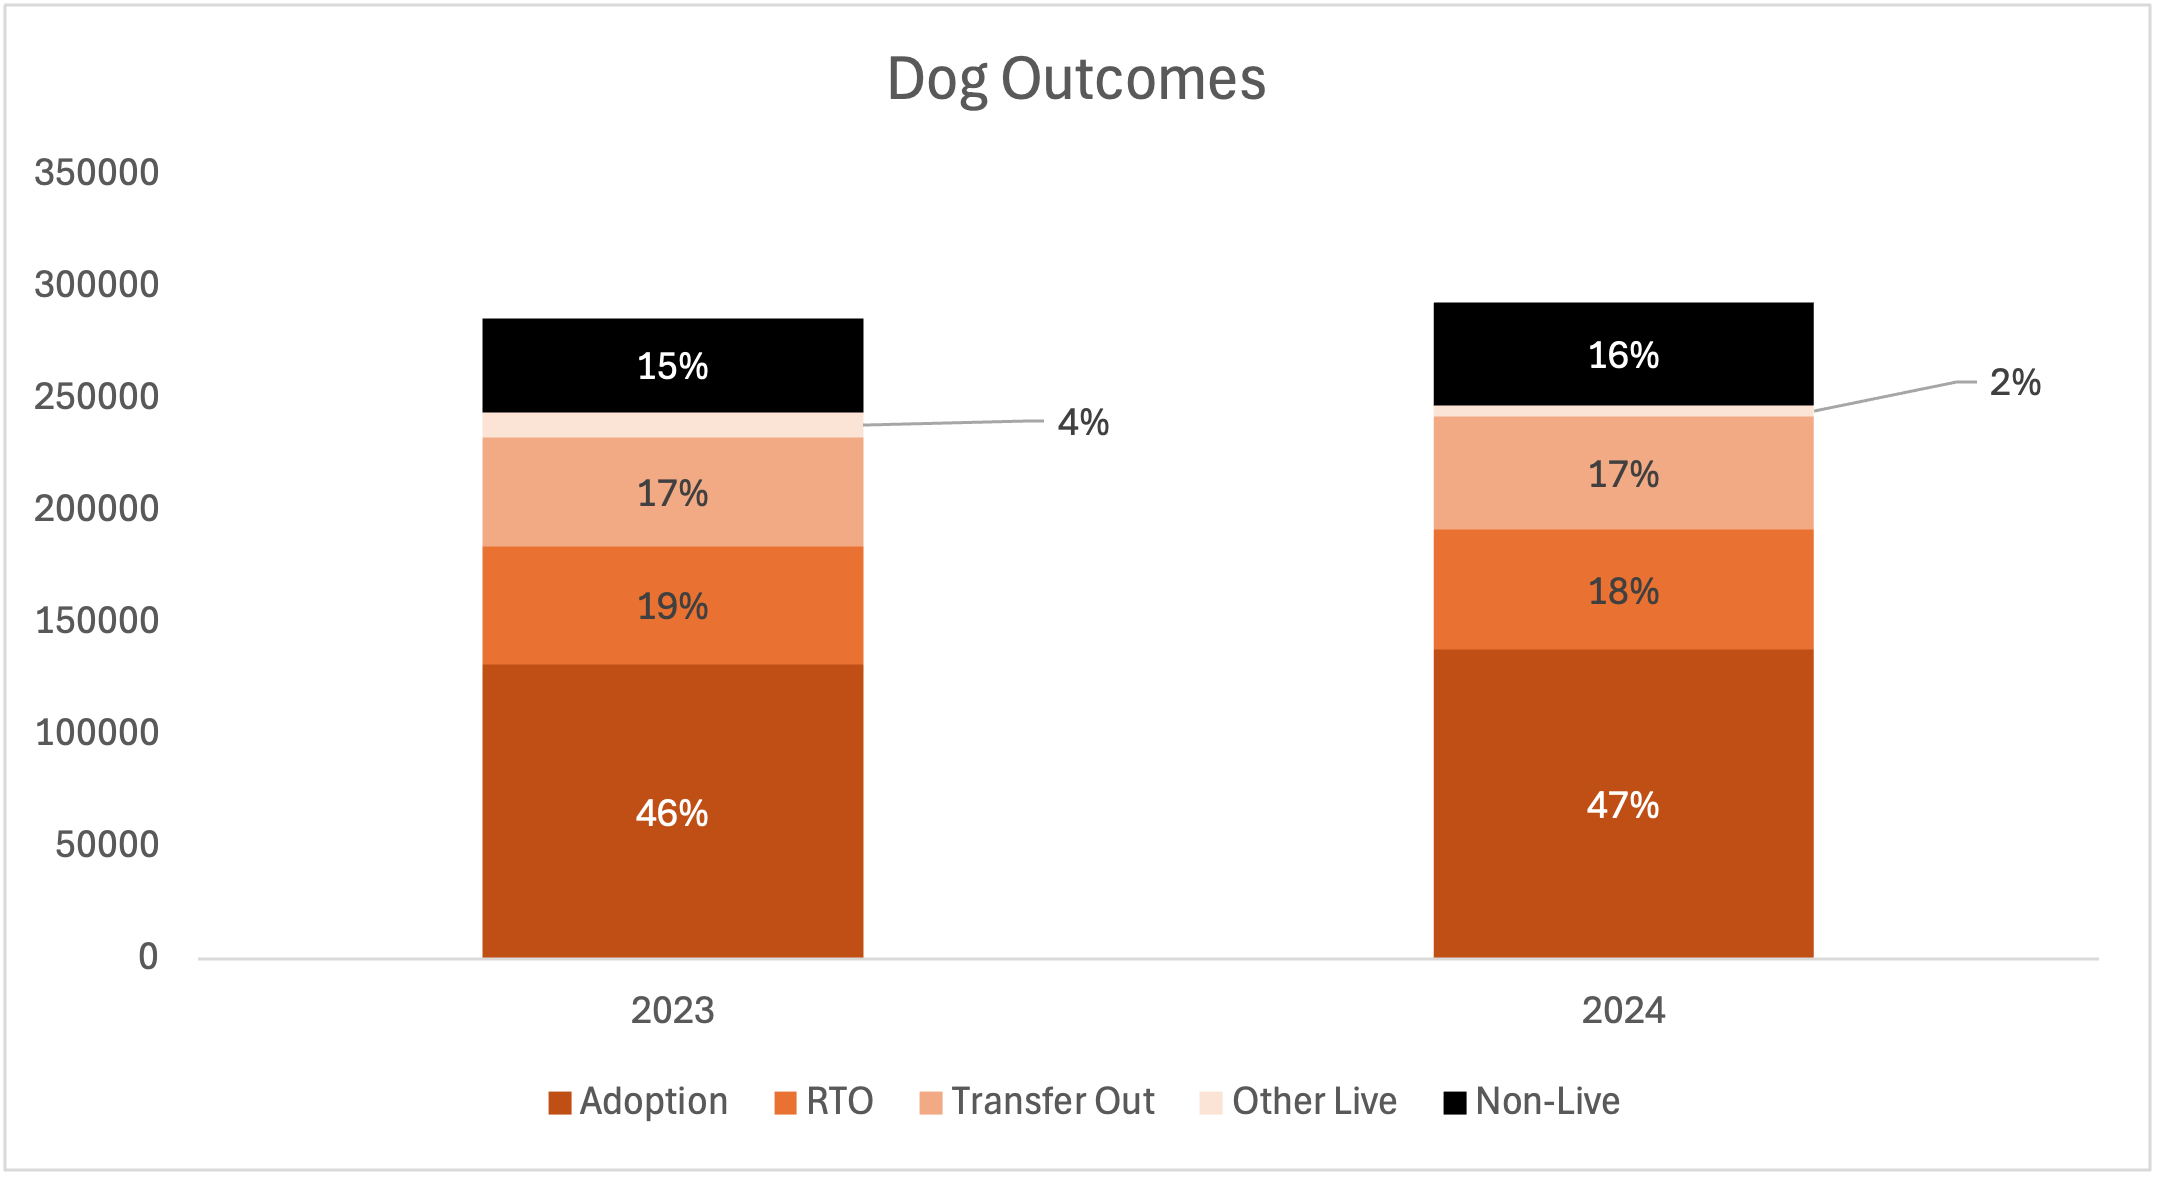
Generally, dog outcomes in the first quarter of 2024 are similar to those in the same period of 2023. Adoptions are up 1%, transfers out are down 1%, and non-live outcomes are up 1%.
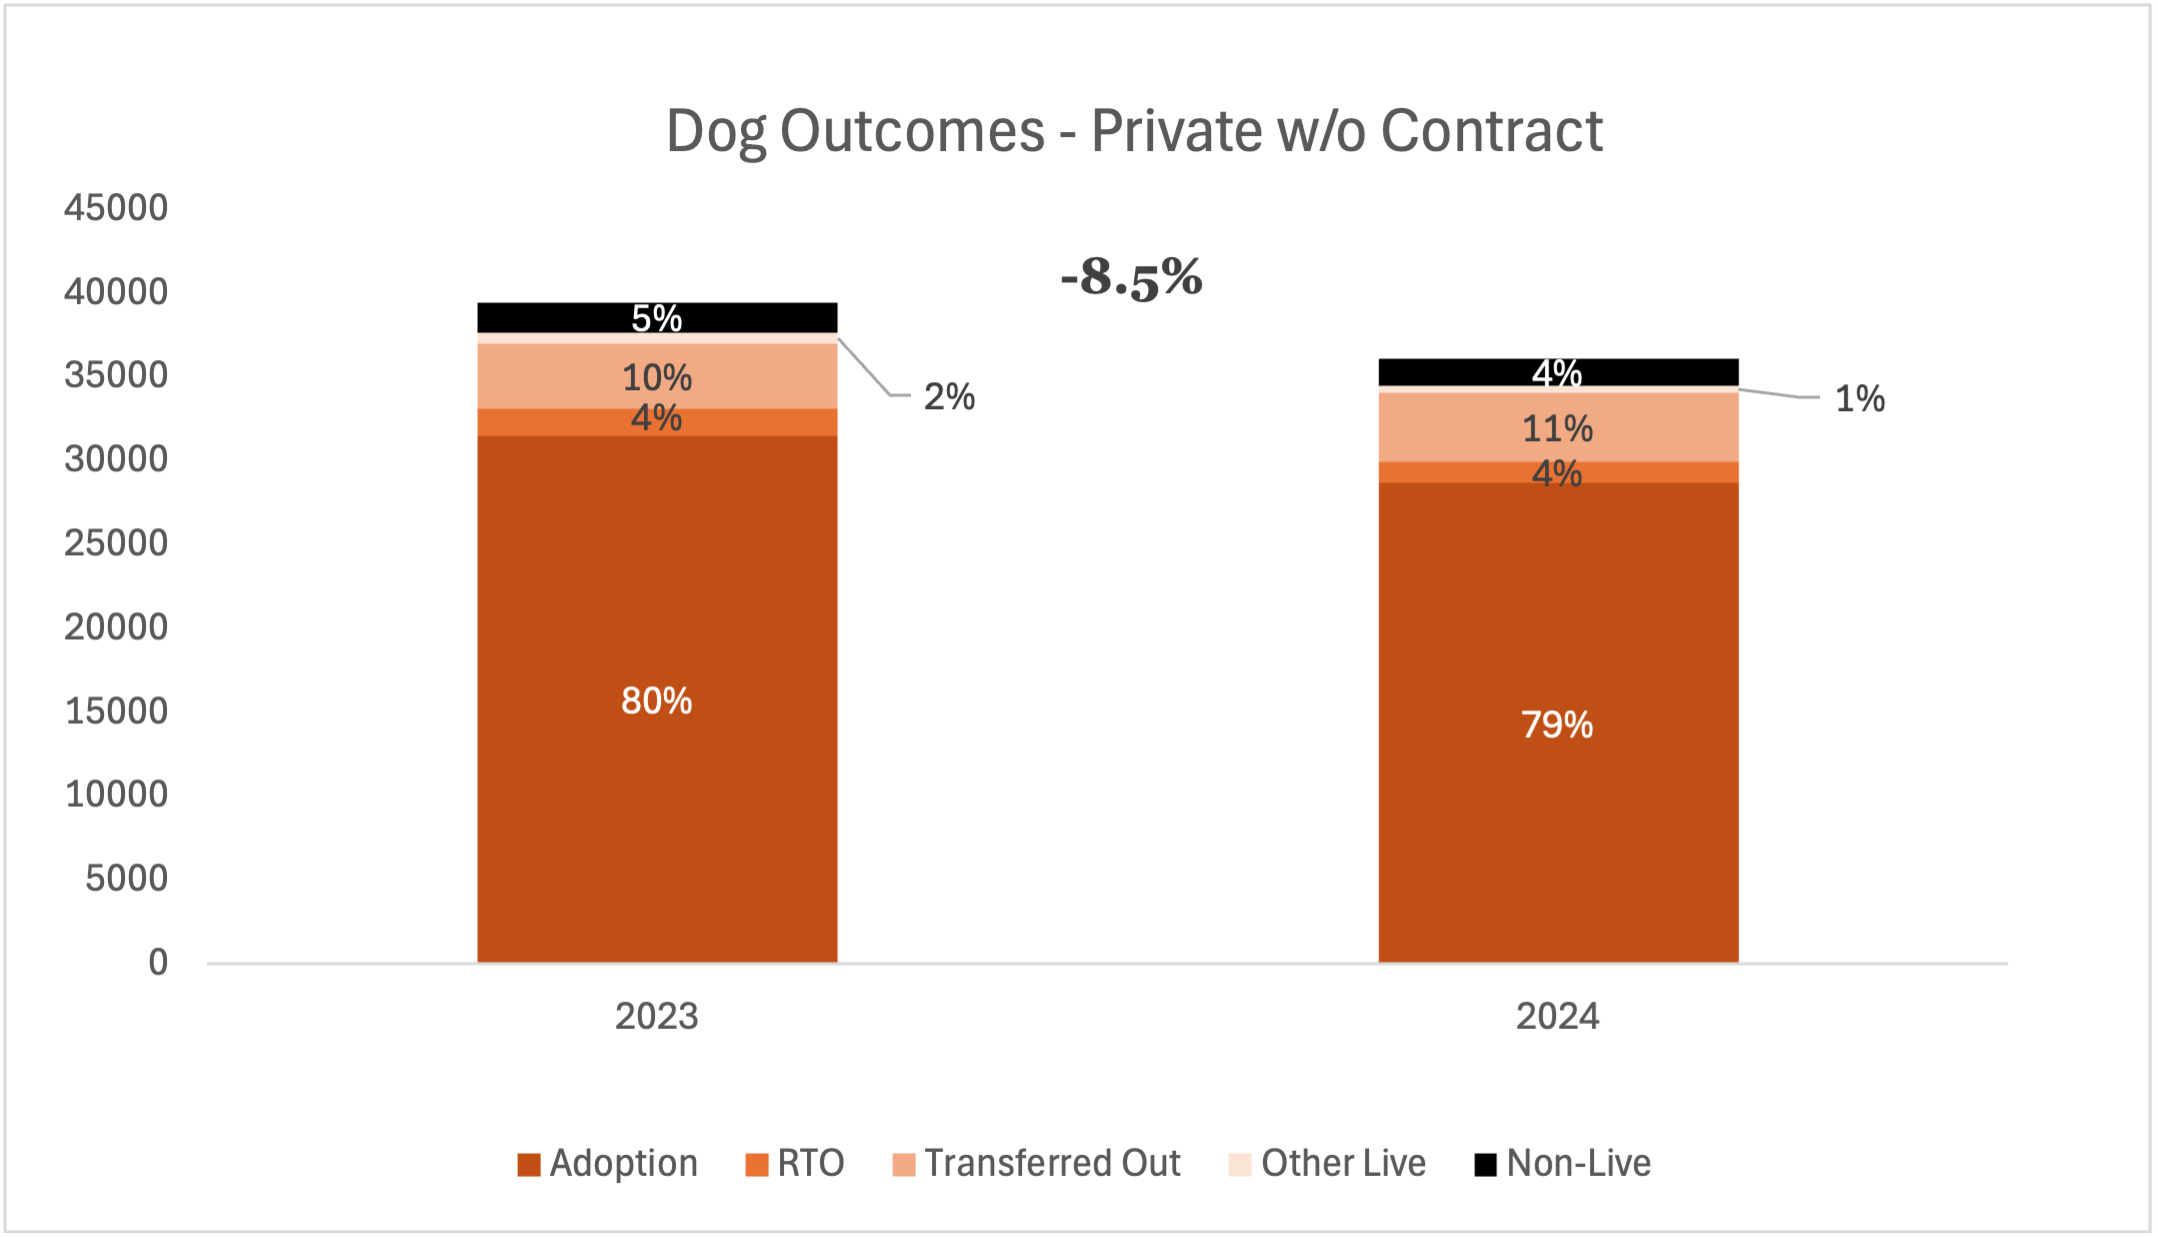
The most noticeable pattern is that 8.5% fewer outcomes for dogs were recorded in Q1 2024 than Q1 2023 in private shelters without contracts. This tracks with the decrease in dog intake observed for private shelters without contracts, meaning the volume of dogs adopted from private shelters without contracts has fallen in Q1 2024.
It is not too late to change your organization’s or wider community’s lifesaving trajectory for the year. Visit Part 2 to see the strategies Best Friends’ data scientists have identified to help your organization address its specific challenges based on your 2023 data.
Appendix
Best Friends' New Data Model
What is it?
Best Friends Animal Society has developed the industry's most sophisticated predictive data estimation model and used it to determine the best way to reduce the lifesaving gap for dogs and cats in U.S. shelters.
The model uses previously collected data from more than 93% of all known brick-and-mortar shelters in the country overlaid with the social vulnerability index, post-pandemic impact information, and county populations, among other factors, to predict shelter outcomes.
The model is dynamic; it is continuously updated with current and historical data as it is collected, allowing us to provide you with the most accurate data available at any given time.
Using Machine Learning, this model provides real-time projections about shelters for which data isn’t available, giving us the ability to direct resources with greater accuracy and maximize lifesaving impacts.
Best Friends will continuously refine the model to include all known predictors of animal intake and outcomes to improve our ability to direct resources to the shelters and communities that need them most.
How is it different from what’s out there?
Best Friends collects data from a representative sample of U.S. shelters rather than relying solely on voluntary submissions. Collected data is obtained directly from shelters, public sources, and FOIA requests.
Why did we do this?
In 2016 when Best Friends put a stake in the ground to lead the country no-kill in 2025 we knew we needed to do things differently. At the time, no one even knew how many shelters there were in the country. Gathering and analyzing data seemed like a logical start. We’ve grown from volunteers calling shelters to ask for data to develop an algorithm that uses artificial intelligence and machine learning to predict shelter outcomes.
Best Friends developed the predictive model because we are at an inflection point in animal sheltering where a single percent change in animal intake or negative outcome does not tell the complete story of a complex, diverse sheltering system recovering from challenges arising from a worldwide pandemic.
Best Friends predictive data model uses the social vulnerability index, post-pandemic impact information, and county populations among other factors because noses-in, noses-out doesn’t tell the whole story of a shelter. Combining all this information enables us to work with partners, animal welfare professionals, advocates, and elected officials to hyper-target exactly the right programs and direct the precise needed resources to communities where they will make the greatest impact and help the country achieve no-kill in 2025.
Shelter Pet Data Alliance (SPDA)
What is it?
The Shelter Pet Data Alliance is an interactive data platform for shelters and rescue groups designed to automate data reporting, provide timely data analysis, and connect them with support to help increase lifesaving. It’s a critical piece that enables us to do our predictive data modeling.
How is it different?
With Shelter Pet Data Alliance, shelters and rescue groups can easily navigate through a dashboard of their intake and outcome data, see what’s happening in organizations around theirs, and beyond, create comparative reports, see local and national trends, and measure their positive impact over time.
SPDA contains the most comprehensive data set from more than 7,760 organizations across the United States.
Shelters and rescue groups can compare their data with other organizations, with the ability to narrow comparisons by species, organization type, geographic area, community size, social vulnerability index and more.
Why did we do this?
We created SPDA because we wanted to collect data straight from the source, pair it with our comprehensive dataset collected through multiple publicly available sources and give it back to you in a way that empowered you to make data-informed programmatic decisions, in the same way we do at Best Friends.
Why Patent Pending?
Patenting Shelter Pet Data Alliance’s one-of-a-kind data and analytics platform means that Best Friends can ensure it will remain transparent and available for animal welfare organizations. The reason we have patent-pending is to protect the tools for partner future use and to allow us to continue to innovate.