
The State of U.S. Animal Sheltering, 2019
For more recent shelter data, check out "The State of U.S. Animal Sheltering, 2021."
Despite the hard work being done to revamp outdated methods, healthy cats and dogs have been dying in our communities’ animal shelters due to large data gaps and inconsistent information. Several years ago, Best Friends Animal Society began compiling a database of all U.S. shelters and collecting data from them. The 2019 dataset is the most comprehensive national dataset to date, and accounts for an estimated 92% of the animals entering U.S. shelters. In this report we share detailed findings from the 2019 dataset and the short term trends impacting shelter animal populations across the nation.
Table of Contents
Findings: Trend Analysis (2016-2019)
- What it means for a shelter, community, state or the county to be no-kill
- Data sources in Best Friends' 2019 dataset
- The difference between gross and net intake
- How save rates are calculated
- How the number of animals killed is calculated
- Gaps in the data
The State of U.S. Animal Sheltering, 2020
Executive Summary
For generations, healthy cats and dogs have been dying in our communities’ animal shelters, with millions of animals losing their lives annually until the last couple of years. For the past 35 years, the animal welfare industry has been working to overhaul outmoded systems and antiquated ways of relating to companion animals. Yet, until recently, no one really knew exactly how many animals were being killed in U.S. animal shelters. For a whole host of reasons, the industry has been left to grapple with large data gaps, inconsistent information, disputes over definitions of terms and a lack of clarity surrounding the number of animals being killed each year. Indeed, even the precise number of animal shelters in the country has remained a matter of considerable speculation.
Several years ago, Best Friends Animal Society began to compile a database of all U.S. shelters. We know now that in 2019, there were 4,850 brick-and-mortar animal shelters1 in the country. In addition to building this master shelter list, Best Friends collects data about how many animals are entering these shelters, the array of outcomes for each animal, and how many animals need to be saved each year for that shelter and community to reach “no-kill” status (i.e., achieving positive outcomes for at least 90% of the animals entering a shelter). The 2019 dataset — the most comprehensive national dataset to date — includes data from 3,608 (74%) of these brick-and-mortar shelters, and accounts for an estimated 92% of the animals entering U.S. shelters.
The data provided by these shelters has improved considerably — in terms of both quantity and quality — in recent years. This progress is the result of numerous efforts undertaken by various coalitions of animal welfare organizations, funders and other key stakeholders. Today, we can see the results of these ambitious initiatives: With an increased emphasis on data-driven decisions comes increased lifesaving.
In this report, we share the top-line results of Best Friends’ 2019 data analysis across four areas of interest: outcomes by species (cat and dog), per-capita findings, state and regional differences, and animal sheltering trends in recent years.
By understanding national, state and regional trends, animal welfare professionals can have a benchmark by which to compare their local progress toward no-kill and can also better understand the data tools that Best Friends has developed and made publicly available. In today’s environment of limited resources and many competing social causes, it is imperative to spend every dollar as wisely as possible. Strategic plans, resource allocation and lifesaving programs all benefit from a data-driven approach.
NOTE: Overall, the number of pets who are suffering from irremediable medical or behavioral issues that compromise their quality of life and prevent them from being rehomed typically does not make up more than 10% of all pets entering the shelter system. Best Friends uses the word "killed" to statistically represent progress toward that 90% save rate benchmark. We also use the word as a way to distinguish between individual animals who lose their lives because of preventable factors, such as lack of shelter space or other resources, and animals who are euthanized, which is an act of true mercy for individual animals who are sick or suffering irremediably.
As a leader in the no-kill movement, Best Friends is very careful with its terminology. We refrain from referring to shelters as “kill shelters” when they have not yet achieved no-kill because this insinuates that the responsibility falls on one entity and the caring people within it, rather than on the community as a whole and on the need for everyone to work together to end the killing of homeless pets.
Key Findings
Shelter intake increased slightly during 2019.
Total shelter intake during 2019 increased 0.23% compared to 2018, from 5.345 million to 5.360 million animals (2.474 million dogs, 2.252 million cats and 634,000 undesignated or estimated). Despite this increase, the 2019 intake total represents a 6.8% reduction from the total in 2016, the first year Best Friends began tracking this metric.
The majority of animals being killed in U.S. shelters are cats.
Cats now comprise more than 69% of the number of animals killed in U.S. shelters (where species was reported). Despite dog intake being 10% higher than cat intake, more than two cats are now being killed for every dog.
A handful of states account for the majority of animals being killed in U.S. shelters.
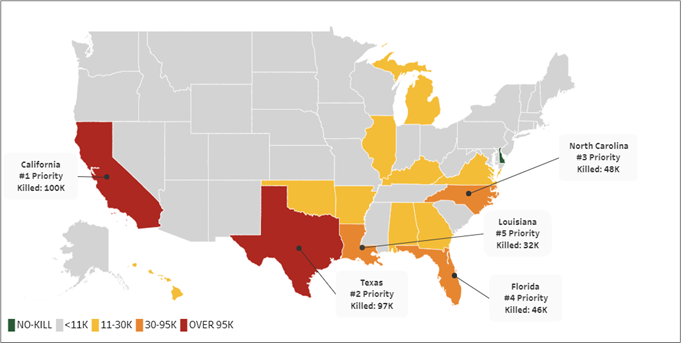
Of the 4,850 brick-and-mortar shelters in the country, 100 (2%) collectively account for 41% of dogs and cats being killed in U.S. shelters. The five states in which the most animals are being killed are California (100,239), Texas (96,707), North Carolina (47,652), Florida (45,503) and Louisiana (32,150). Collectively, these states account for 52% of the animals killed in U.S. shelters during 2019.
Increases in positive outcomes reveal continued progress.
Total deaths in shelters during 2019 decreased 10% compared to 2018, from 1.251 million to 1.124 million animals. The number of animals estimated to be healthy and treatable decreased 15% compared to 2018, from 732,797 to 625,400 animals. Live outcomes have increased 10.9% since 2016, the first year that Best Friends began tracking this metric. The save rate for all U.S. shelters increased 2.4 percentage points during 2019 compared to 2018, to 79%.
The numbers of no-kill shelters and communities continue to increase.
The number of shelters achieving no-kill status increased by 15% compared to 2018, from 1,844 to 2,126 shelters (now 44% of U.S. shelters). The number of communities achieving no-kill status increased 27% compared to 2018, from 4,297 to 5,460 (now 35% of all communities with sheltering services).
Introduction
For generations, healthy cats and dogs have been dying in our communities’ animal shelters, with millions of animals losing their lives annually until the last couple of years. For the past 35 years, the animal welfare industry has been working to overhaul outmoded systems and antiquated ways of relating to companion animals. Yet, until recently, no one really knew exactly how many animals were being killed in U.S. animal shelters.
Because there is no mandated federal reporting of animal shelter performance, it is left to states and municipalities to decide if and how they want to track this data. Very few states require state-level reporting and those that do often collect different data. And in states that don’t require reporting, it has been left to the municipalities or the shelters themselves to define, record and track their performance metrics.
The industry as a whole has been left to grapple with large data gaps, inconsistent information, disputes over definitions of terms and a lack of clarity surrounding the number of animals being killed each year. Indeed, even the precise number of animal shelters in the country has remained a matter of considerable speculation.
Several years ago, Best Friends Animal Society began to compile a database of all U.S. shelters. We know now that in 2019, there were 4,850 brick-and-mortar animal shelters in the country. In addition to building and maintaining this master shelter list, Best Friends collects data about how many animals are entering these shelters, the array of outcomes for each animal, and how many animals need to be saved each year for that shelter and community to reach “no-kill” status (i.e., achieving positive outcomes for at least 90% of the animals entering a shelter).
In this report, we share the top-line results of Best Friends’ 2019 data analysis across four areas of interest: outcomes by species (cat and dog), per-capita findings, state and regional differences, and animal sheltering trends in recent years.
By understanding national, regional and state trends, animal welfare professionals can have a benchmark by which to compare their local progress toward no-kill and can also better understand the data tools that Best Friends has developed and made publicly available. In today’s environment of limited resources and many competing social causes, it is imperative to spend every dollar as wisely as possible. Strategic plans, resource allocation and lifesaving programs all benefit from a data-driven approach.
Background
Historically, animal welfare has lacked comprehensive data regarding sheltered cats and dogs. A variety of efforts have been undertaken in the past to bridge this long-standing industry gap. Some are still in progress while others have not been maintained or have been limited in their efficacy because of lack of consistency, completeness or knowledge of how best to apply the information.
A number of regional efforts were conducted in the 1990s, including the California Sheltering Agencies Survey, the Iowa Federation of Humane Societies Animal Shelter Survey and the Progressive Animal Welfare Society Report on Washington State Animal Shelter Statistics.
A national effort was initiated in 1993 with the formation of the National Council on Pet Population Study and Policy to gather and analyze data on the number, origin and disposition of companion animals (dogs and cats) in the United States. Unfortunately, only about 1,100 of the estimated 4,700 shelters responded, making it difficult to draw conclusions about intake, outcomes or national trends.2
In 2004, 20 leaders, representing national organizations and funders in the industry, gathered to find common ground in an otherwise divided animal welfare field. The result was the Asilomar Accords. But this effort, too, proved to be problematic in delivering consistent, non-subjective reporting standards that would allow for accurate comparative analyses. In addition, adoption of the Asilomar Accords was insufficient to provide a representative view of sheltering data nationally.
By 2010 — after more than a century of animal sheltering in the U.S. — it was considered unacceptable that the best we could do as an industry was to estimate that millions of animals enter the nation’s shelters every year and that some large percentage of these animals do not leave alive. As a result of this widespread dissatisfaction, many of the same organizations that collaborated on the Asilomar Accords and others worked together to create the Basic Data Matrix,3 which currently serves as the industry standard regarding the minimum amount of data that shelters should be collecting and reporting annually.
In 2012, Best Friends joined with these same organizations, collaborating in the creation of Shelter Animals Count (SAC), a national database of self-reported data to serve as the most credible and complete source of data on sheltered animals for the industry — a critical dependency for our mission advancement and assessment.
By 2016, however, Best Friends was narrowing its strategic focus with the ambitious goal of leading the country to no-kill by 2025. This goal required more complete and representative shelter data than SAC had accumulated through its voluntary data reporting.
So, in late 2016, Best Friends began its first data collection effort to augment the available industry data and apply an estimation methodology for missing data, thereby creating the most comprehensive national dataset to date. We have continued this process annually, increasing the number of shelters accounted for with each year’s dataset. In July 2019, we introduced our public-facing pet lifesaving dashboard4 for publishing national-, state-, community- and shelter-level data for calendar year 2018.
In June 2020, the pet lifesaving dashboard was updated with the 2019 dataset, expanding on earlier efforts and making it the most complete compilation of sheltering data in the industry, including calendar-year data from more than 3,600 brick-and-mortar shelters. This latest dataset represents 74% of the 4,850 shelters in the country and accounts for an estimated 92% of the animals entering U.S. shelters in 2019.
The growing no-kill movement and the importance of transparency
A decade ago, there were fewer than 10 communities known to have achieved the recognized no-kill benchmark of a 90% save rate.5 Today, thanks to considerable lifesaving progress and improved data collection, we know that the number of no-kill communities now exceeds 5,400, and the country has its first no-kill state, Delaware, with Rhode Island extremely close (92% of communities have reached the no-kill benchmark).
Reporting on what has been accomplished is encouraging, to be sure, but the impetus behind our data collection efforts has less to do with looking back than with looking ahead. The comprehensive dataset now available allows us to draw an increasingly detailed map of the work that needs to be done to achieve no-kill by 2025 at the community and shelter levels. With a better understanding of where the remaining “hot spots” are, we can better deploy our collective resources for the greatest lifesaving impact by targeting programs more precisely. And our ongoing collection and analysis allows us to understand the efficacy of these programs, assess overall progress, and identify areas of further need and focus.
Transparency is central to the no-kill philosophy and to the effective implementation of no-kill programs. Like any industry, the animal welfare field is ill-equipped to solve a problem if we can’t define the nature of that problem. And community members — whose engagement is essential for lifesaving progress — cannot help solve a problem they don’t know exists.
Animal shelter transparency begins with the reporting of simple numbers: the number of dogs and cats who entered a shelter in a given time period, the number of animals with positive outcomes (e.g., animals who were adopted, animals returned to their owners, community cats returned to the field6) and the number of animals with negative outcomes (e.g., animals who died, were lost in care or were euthanized). The more detailed the data, the more accurately programs can be targeted to particular needs, evaluated for efficacy and refined.
In October 2018, Best Friends was proud to co-author a landmark position statement jointly issued by eight of the nation’s leading animal welfare organizations and foundations. Calling upon every organization in the country that takes companion animals into their care to share their data, Best Friends — along with the American Society for the Prevention of Cruelty to Animals, Michelson Found Animals Foundation, the Humane Society of the United States, Maddie’s Fund, PetSmart Charities, Petco Foundation and the WaterShed Animal Fund — issued the following joint statement of shared commitment to transparency:
“As national leaders and funders of animal welfare in North America, we believe that organizations should be transparent about the number of animals that come under their care, and the outcome for all of those animals. That is why we support the public availability of key data (the basic data matrix as defined by Shelter Animals Count), from all animal welfare agencies and nonprofits, both publicly and privately funded and whether or not they provide government animal control services or humane law enforcement.”7
Findings: 2019 Details
The results of our 2019 dataset analysis reveal several signs of improvement in lifesaving as well as specific areas in need of additional effort. The insights gleaned from this analysis are intended to help shelter leadership, policymakers, animal welfare advocates and other stakeholders target lifesaving programs to save the animals being killed in U.S. shelters.
National progress indicators
The 2019 dataset reveals a slight increase (0.23%) in intake compared to 2018, from 5.345 million to 5.360 million animals (2.474 million dogs, 2.252 million cats and 634,000 undesignated or estimated). Nevertheless, there are also several important improvements in key metrics when compared to the 2018 dataset:
- Total deaths decreased 10%, from 1.251 million to 1.124 million dogs and cats.
- The total number of dogs and cats killed (unnecessary deaths of animals estimated to be healthy and treatable) decreased 15%, from 732,797 to 625,400.
- The national save rate increased 2.4 percentage points, to 79%.
- The number of no-kill shelters rose 15% (compared to a 5% increase in 2018), to 2,126 (now 44% of all U.S. shelters).
- The number of no-kill communities rose 27% (compared to an 8% increase in 2018), to 5,460 (now 35% of all communities with sheltering services).
Since 2016, when Best Friends declared the goal to lead the country to no-kill by 2025, the number of cats and dogs being killed in U.S. shelters has decreased by 58% (Figure 1). That’s 2.3 million more animals who have been saved through targeted programming in shelters.
Findings by state
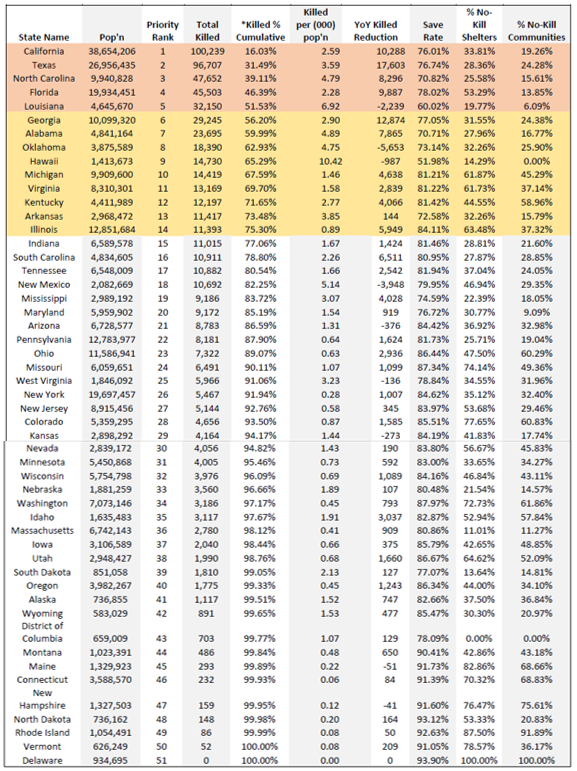
In 2018, one of the most noteworthy findings was that five states accounted for more than half of the nation’s killing of animals in shelters. That led to a focus on and prioritization of programming and shelter partnerships. In 2019, some important shifts occurred as a result of significant lifesaving improvements. While five states continue to make up more than half of the nation’s lifesaving gap, tremendous progress in Texas moved it to the number two spot, shifting California to number one. And Georgia cut its lifesaving gap by nearly a third in a single year, moving it out of the top five to number six, making Louisiana the new number five state for programming focus (Table 1).
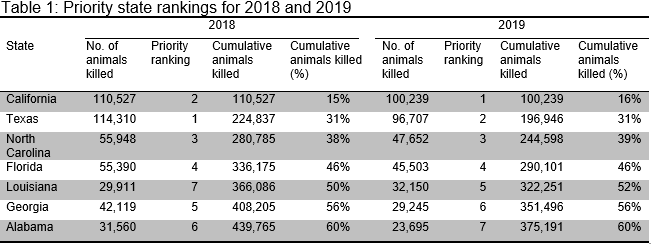
The new top five (California, Texas, North Carolina, Florida and Louisiana) have a combined lifesaving gap of 322,251 dogs and cats killed annually (52% of the nation’s total). These five states, together with the nine states shown in yellow, account for 75% of the dogs and cats killed nationwide (Figure 2).
Other state-level highlights from the 2019 dataset include:
- Delaware remains the only no-kill state.
- Rhode Island is inching closer to becoming no-kill, with 92% of its communities now no-kill and just 86 dogs and cats killed statewide.
- In 18 states, more than half of the shelters achieved no-kill status.
- Eight states (Delaware, North Dakota, Rhode Island, Maine, New Hampshire, Connecticut, Vermont and Montana) have aggregated save rates greater than 90%. (Except for Delaware, however, these states still have animals being killed, with one or more shelters falling below the 90% no-kill benchmark.)
- Only two states have save rates that are less than 70%: Hawaii at 52% and Louisiana at 60%.
- Hawaii’s per-capita number of animals killed is by far the highest, at 10.4 per 1,000 residents, more than five times the national aggregate of 2.0.
- In 35 states, per-capita rates of animals killed are less than 2.0 per 1,000 residents.
A table of state-level statistics for all states can be found in the appendix.
Findings by region
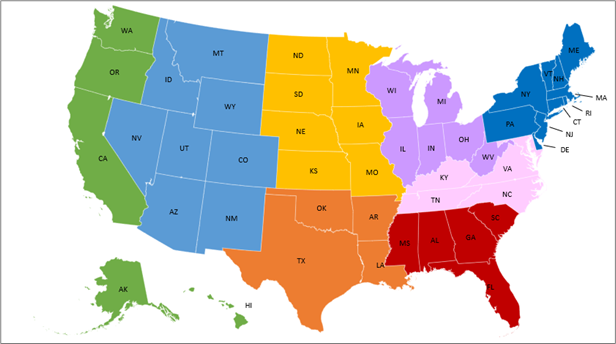
Best Friends defines eight regions of the country for programming and strategy implementation (Figure 3).
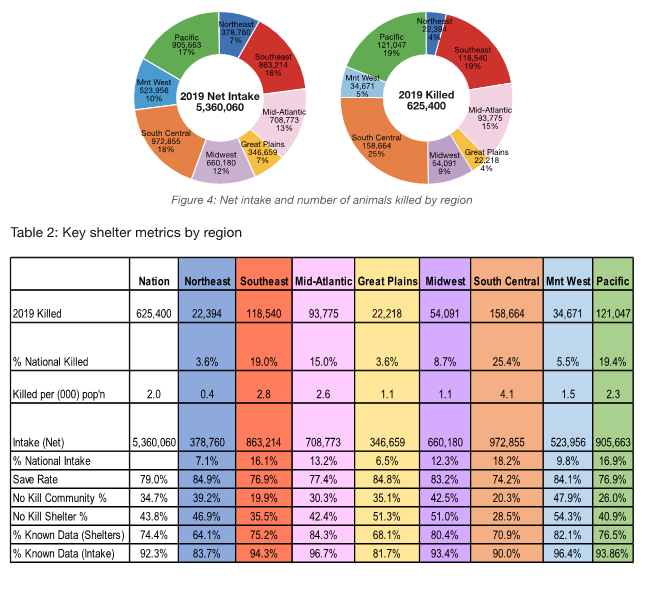
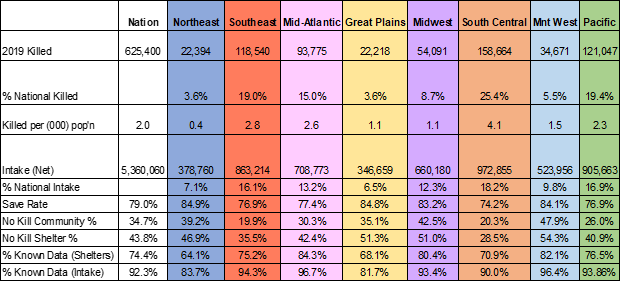
Of the 4,850 brick-and-mortar shelters in the country, 100 (2%) together account for 41% of the nation’s dogs and cats killed. The 2019 dataset reveals several important regional differences (Figure 4), including:
- The South Central region accounts for both the largest intake and the largest share of animals killed (18.2% and 25.4%, respectively).
- The per-capita rate of animals killed in the Mid-Atlantic, Southeast, South Central and Pacific regions are all higher than the nation as a whole (2.0 per 1,000 residents), with South Central nearly 50% higher than the second highest region (Southeast).
- The Mountain West region leads the nation in the proportion of no-kill shelters and communities.
- More than half of the shelters in the Mountain West, Great Plains and Midwest regions are no-kill.
- The Southeast had the greatest reduction in the number of animals killed, at 41,165 (25.8% fewer than in 2018), and also the greatest save rate increase (more than five percentage points).
- While data completeness is strong across the board, the Northeast and Great Plains have the largest data gaps and should be a priority for ongoing data collection.
Findings by species
The 2019 dataset reveals some important differences between the outcomes for dogs and cats, including:
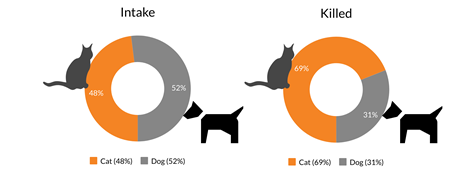
- There is an increasing gap for cats vs. dogs, even compared to 2018, with cats now comprising more than 69% of the animals killed in U.S. shelters (where species was reported in collected data).
- Despite dog intake continuing to be higher than cat intake, more than two cats are now being killed for every dog (Figure 5).
- Cats make up the highest percentage of animals killed in 36 states. Dogs and cats are dying unnecessarily in equal proportion in 12 states, and only two states, plus the District of Columbia, show dogs being killed at a higher rate.
Findings: Trend Analysis (2016-2019)
The sample used for trend analysis
The basis for analyzing sheltering trends was the subset of data collected from 1,178 brick-and-mortar shelters that reported data consistently over the past four publication years (2016–2019) to isolate true trend (from changes that resulted from growth in data collection). The resulting trends could then be used to provide overall insight and differences observed by organization type, region and species.
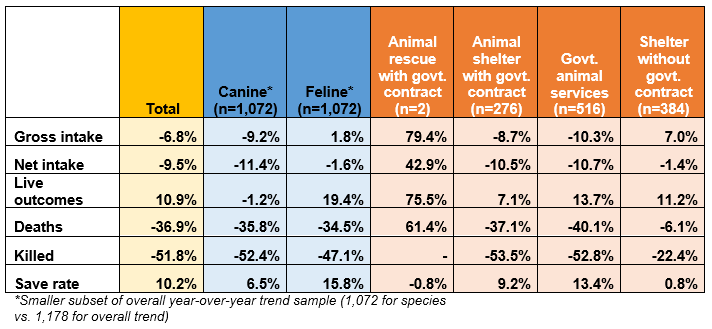
It is important to note that government animal services agencies and the South Central and Midwest regions are slightly underrepresented in this sample. The sample sizes are sufficient, however, to segment by organization type (animal rescue with government contract, animal shelter with government contract, government animal services, or shelter without a government contract) and regional differences. A total of 1,072 organizations within this sample had year-over-year species-specific reporting, and serve as the basis for species findings (Tables 3 and 4).
Intake
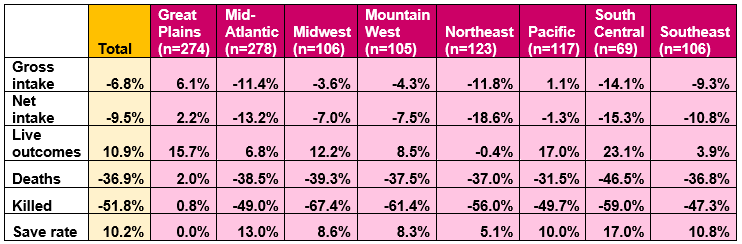
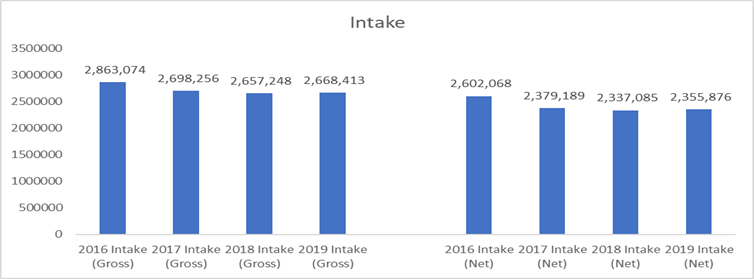
Between 2016 and 2019, gross intakes decreased 6.8% (9.5% net), with the largest decrease occurring from 2016 to 2017 (5.8% gross, 8.6% net). A slight increase was experienced in 2019, reversing the previous downward trend (Figure 6).8 Some additional details:
- The greatest decrease in intakes was seen in government animal services, with a 10.3% decrease in gross intake, the majority of which occurred from 2016 to 2017 (Table 3).
- Shelters without a government contract experienced year-over-year intake increases, totaling 7% from 2016 to 2019.
- With the exception of the Great Plains region (which had a 6.1% increase in gross intakes from 2016 to 2019), gross intakes have decreased across all regions. The most significant decreases were in the South Central region, with a 14.1% decrease from 2016 to 2019. The largest decreases were seen from 2016 to 2017.
- Dog intakes have decreased year-over-year every reporting year, with an overall decrease of 9.2% from 2016 to 2019. Cat intakes decreased from 2016 to 2017 (1.3%) and 2017 to 2018 (0.5%), but increased 3.6% from 2018 to 2019, for an overall increase of 1.8% from 2016 to 2019.
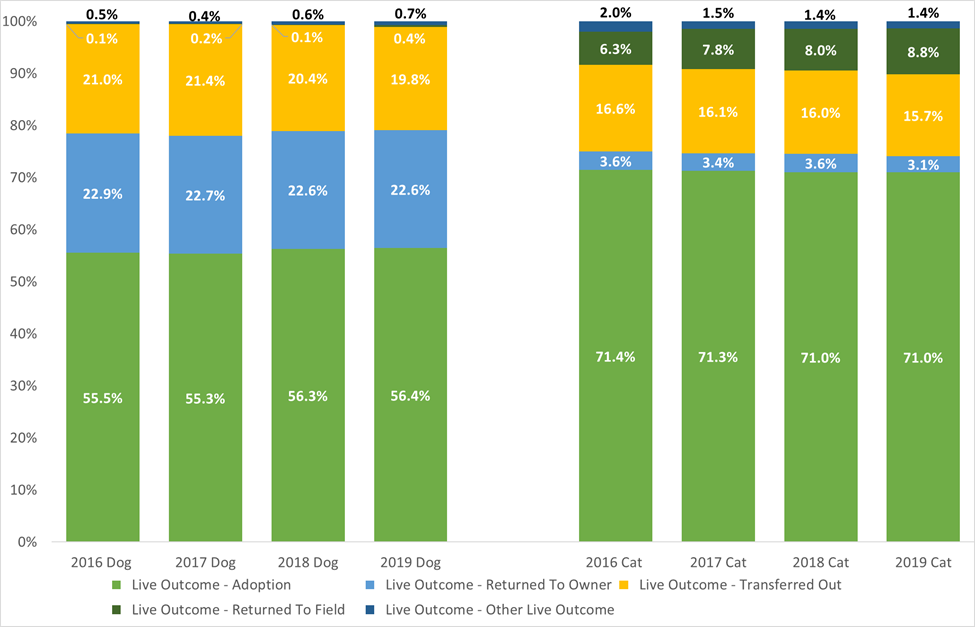
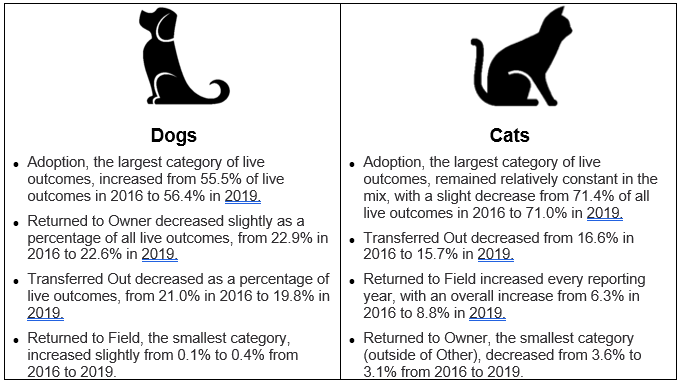
Live outcomes
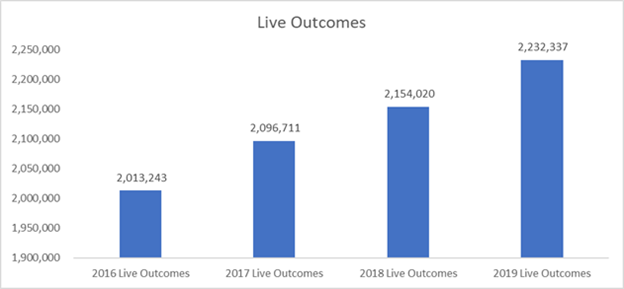
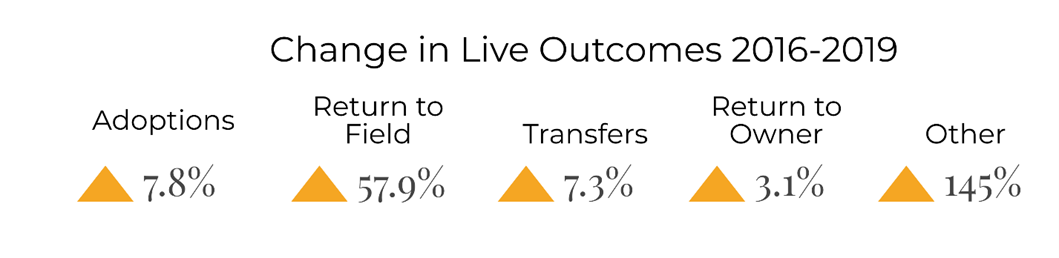
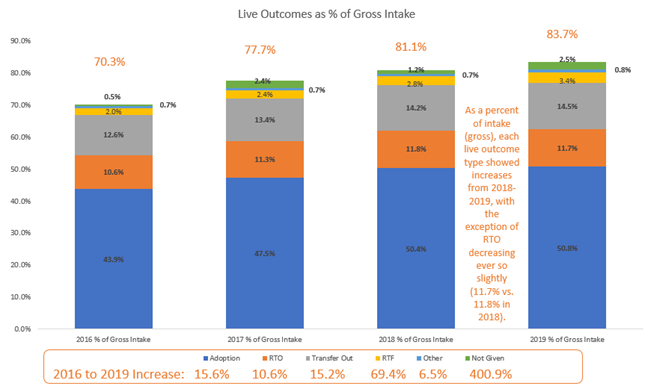
Live outcomes show year-over-year increases for each reporting year, with an overall increase of 10.9% from 2016 to 2019 (Figure 7). Comparing each live outcome type as a percentage of the total over time, there was a shift in the mix of various outcomes, with return-to-field (for community cats) playing an increasing role (Figures 8 and 9). Some additional details:
- The greatest increases were seen in government animal services (13.7%) and shelters without government contracts (11.2%).
- With the exception of the Northeast (which had a 0.4% decrease in live outcomes from 2016 to 2019), live outcomes increased across all regions. The most significant increases were in the South Central region (23.1%) from 2016 to 2019.
- Live outcomes for dogs decreased 1.2% from 2016 to 2019. Live outcomes for cats have increased every reporting year (4.4% from 2016 to 2017, 6.1% from 2017 to 2018, and 7.7% from 2018 to 2019), with an overall increase of 19.4%.
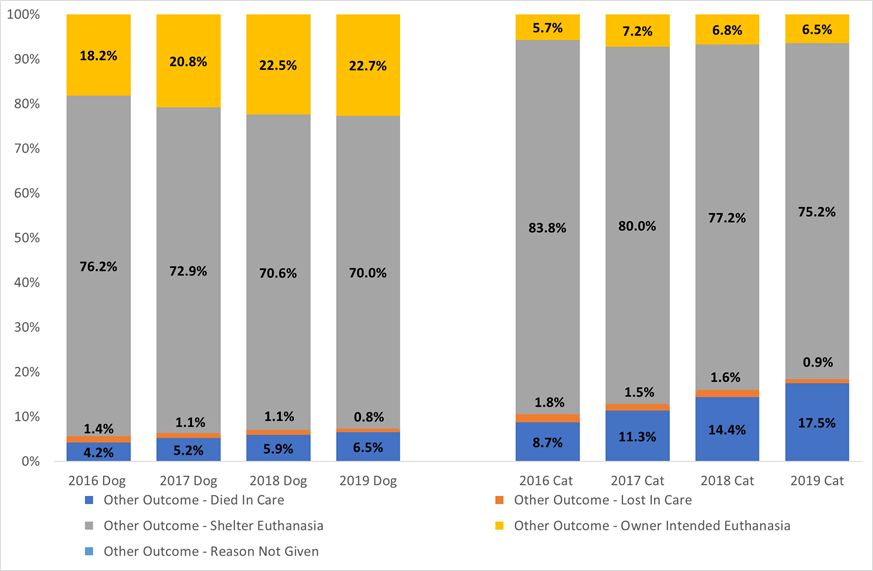
Non-live outcomes
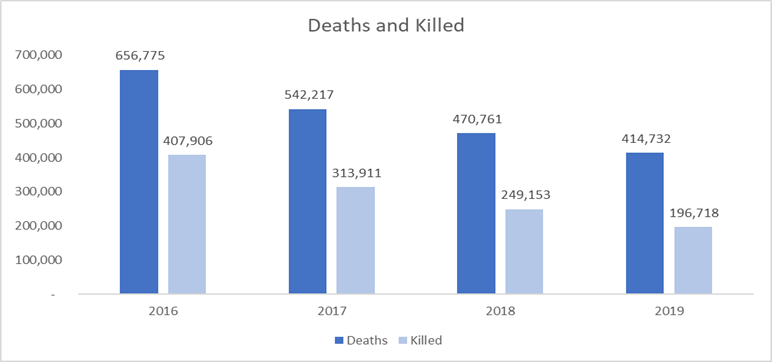
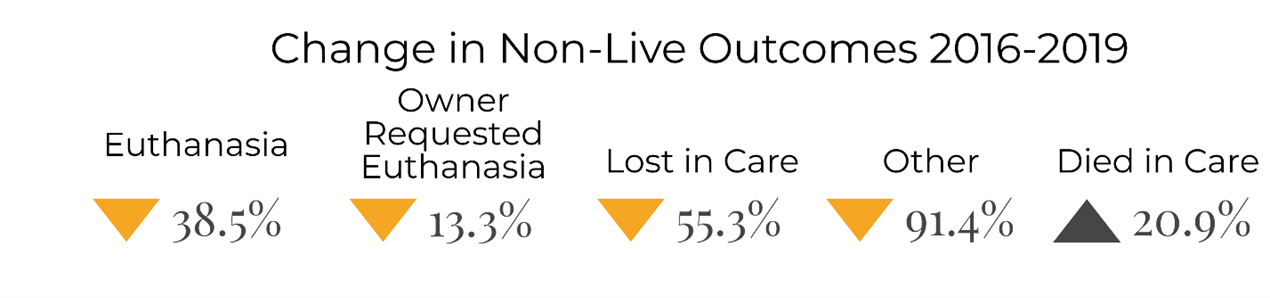
Non-live outcomes have seen a steady year-over-year decrease, with an overall decrease of 36.9% from 2016 to 2019 (Figure 10). There is an upward trend, however, in the number of animals who died in care (driven by cats), with an overall increase of 20.9%. This is likely a reflection of increased efforts to save neonatal kittens (Figure 11).
Some additional details:
- Government animal services (40.1%) and shelters with a government contract (37.1%) had significant decreases in deaths from 2016 to 2019, compared to shelters without a government contract (6.1%)
- Steady decreases were experienced across all regions, with the exception of the Great Plains, which had a lower number of deaths in 2016 than in subsequent years (and an overall 2016–2019 increase of 2%). All other regions showed decreases, ranging from 31.5% in the Pacific to 46.5% in South Central.
- Canine deaths have decreased significantly every reporting year, with a total decrease of 35.8% from 2016 to 2019. Feline deaths have also decreased significantly every reporting year, with a total decrease of 34.5% from 2016 to 2019.
Species
Of the species sample, 614 shelters reported dog intake and outcomes, and 634 shelters reported cat intake and outcomes. That data was used to further analyze intake and outcome subtype differences and mix changes over time. Progress is being made with both species, but differently. Canines have seen a significant decrease in intake during the past four years, while felines have seen the largest growth in live outcomes and save rate (Figures 12 and 13).
Intake (as a percentage of all intakes)
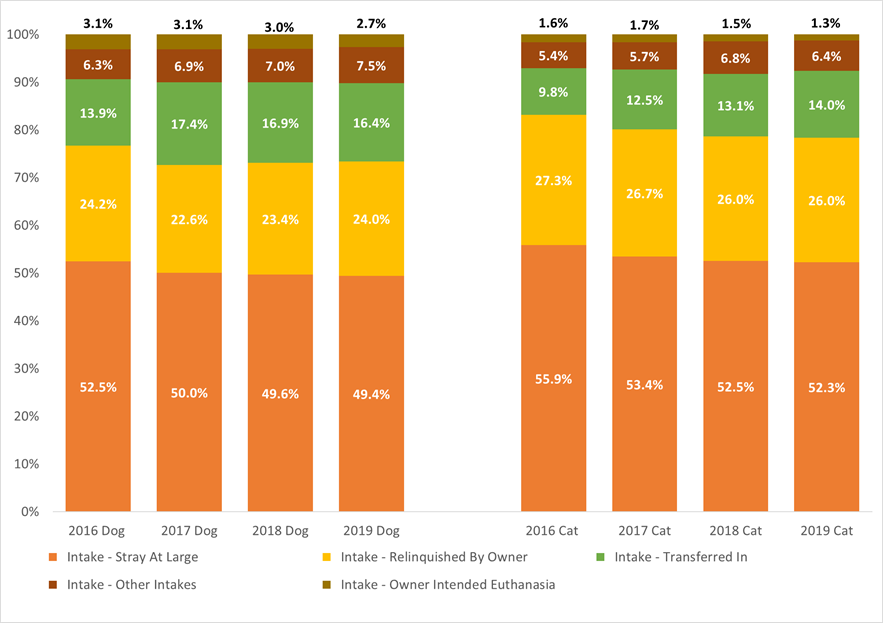
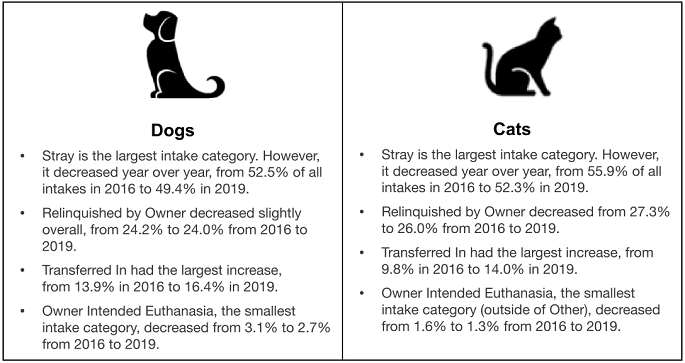
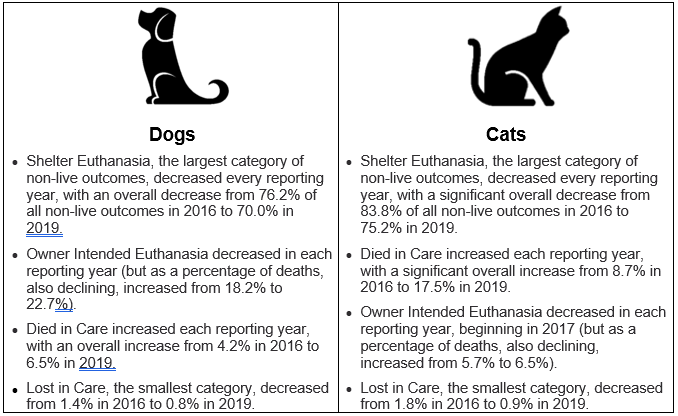
All categories of non-live outcomes have seen decreases for both species since 2017, with the exception of the Died in Care category for cats, which may be due to a higher number of shelters putting more emphasis on saving vulnerable populations such as neonatal kittens. Euthanasia is by far the most common type of negative outcome for both species (Figure 14).
Conclusions
Analysis of the 2019 dataset reveals several signs of improvement in U.S. shelters. The number of dogs and cats dying is down 10% from the previous year, for example, and the number killed is down 15%. Nevertheless, this progress has been uneven. Just 2% of shelters account for 41% of the dogs and cats being killed. And, although more dogs are entering our shelters, nearly 70% of the animals being killed are cats. The findings outlined in this report should help shelters, policymakers, animal welfare advocates and other stakeholders identify and implement lifesaving programs to save more of the animals in their communities.
Research Methods and Analysis
To better understand the implications of the 2019 dataset for animal shelters, the larger animal welfare community and public policy, it’s important to understand how the data was obtained and analyzed. The descriptions and definitions provided here are also in keeping with Best Friends’ commitment to transparency.
What it means for a shelter, community, state or the country to be no-kill9
A no-kill community acts on the belief that every dog and cat deserves to live — and focuses on saving lives through pet adoption, transfer and transport, trap-neuter-return, return-to-field and other community support programs. While achieving a certain percentage of lives saved is not the goal, a quantitative benchmark can help guide lifesaving efforts. Saving 90% or more of the animals who enter shelters is the current benchmark for no-kill.
For a community to be considered no-kill, each of its brick-and-mortar animal shelters must be at a 90% save rate (defined below) or higher for the animals in their care (i.e., dogs and cats combined). “Community,” in this case, is generally a city, town, village, borough or other area designated as a “place” by the U.S. Census Bureau. In some cases, government structures, unincorporated communities and other census-designated places are included in order to be consistent with census bureau data.
Data is compiled from all brick-and-mortar shelters for which calendar year 2019 data was available (or CY 2018 where CY 2019 wasn’t provided, and likewise using CY 2017 data where more recent data wasn’t available). Data fields are collected consistent with the Basic Data Matrix industry standard,10 and include the following for dogs and cats (data for other species is not collected at this time):
- Live intake: stray/at-large, relinquished by owner, owner-intended euthanasia, transferred in from agency or other intakes
- Outcomes: adoption, returned to owner, transferred to another agency, returned to field (for community cats), other live outcome, died in care, lost in care, shelter euthanasia or owner-intended euthanasia
To support our shelter data collection, we developed and maintain a master shelter list. This is a “living document,” since shelters open and close, and the jurisdictions they serve also change as animal services contracts change. It was compiled and is maintained, through manual research, state by state and county by county, to identify all organizations with a physical location that admit and house companion animals. Next, research was conducted to identify the service area coverage for all organizations.
Sources for shelter data include Shelter Animals Count (self-reported), public websites, government-provided data and voluntary data submissions. Where information is sourced from Shelter Animals Count data, Shelter Animals Count specifically disclaims all responsibility for any analysis, interpretations, conclusions and opinions contained in the information presented.11 And while Best Friends attempts to validate data sources, we cannot guarantee the accuracy of these sources. A community is recognized as no-kill when it meets the following criteria:
- Best Friends has access to data for all known brick-and-mortar shelters located in, or providing municipal shelter services to, the community; and
- All shelters providing services to the community have achieved a 90% save rate or higher for the animals in their care (i.e., dogs and cats combined).
Data sources in Best Friends’ 2019 dataset
Each data record represents a geographical area, usually an area circumscribed by the county/FIPS code, the unique official code given to each county by the U.S. Census Bureau. This data was collected through the sources listed above, and may or may not have included all shelters in that geographical area. Statewide datasets were compiled from these county-level records.
Data from counties for which all shelter data could be collected was used to develop a regional per-capita rate for animal intake, number of shelter deaths and number of animals killed. To account for counties where data was incomplete or missing entirely, a conservative estimation factor was then applied to the known data, thereby minimizing the likelihood of underestimating the national death rate. The estimation methodology was formulated by the Best Friends business intelligence team in consultation with an outside research advisor and economist. Using the master shelter list, this rate was applied to areas lacking complete shelter data as follows:
- If there are no brick-and-mortar shelters in the master shelter list, the county was considered a non-service area and no estimation factor was applied;
- If none of the shelters in a county have verified data, the estimation factor was used for the entire county; and
- If some (but not all) shelter data is known for a county, a 15% estimation factor was added to the known data.
The difference between gross and net intake
Gross intake is the total number of live intakes at the shelter. Net intake (live intakes minus transfers) is used for any level of aggregation beyond the shelter level, thereby avoiding the double-counting of these animals.
How save rates are calculated12
For all individual shelters, a gross save-rate calculation is used:
- (Live Intakes – Died in Care – Lost in Care – Shelter Euthanasia – Owner-Intended Euthanasia) / (Live Intakes)
At the state and national levels, a net save-rate calculation is used because it’s important to remove transfers between agencies, thereby avoiding the double-counting of these animals:
- (Live Intakes – Transfers In – Died in Care – Lost in Care – Shelter Euthanasia – Owner-Intended Euthanasia) / (Live Intakes – Transfers In)
How the number of animals killed is calculated
Shelter outcomes in which animals are not leaving the shelter alive include Died in Care, Lost in Care, Shelter Euthanasia and Owner-Intended Euthanasia. In recognition of the no-kill benchmark of 90%, Best Friends uses the following calculation to determine the number of animals killed in a shelter in addition to these non-live outcomes:
- (Died in Care + Lost in Care + Shelter Euthanasia + Owner-Intended Euthanasia) – (0.10 × Live Intake)
Gaps in the data
For 2019, we have data from 3,608 brick-and-mortar shelters nationwide, 74% of the total number of those identified in our master shelter list. Because our data collection process focuses on high-volume and municipal shelters, the combined intake of collected data is much higher — estimated to account for 92% of total nationwide shelter intake. The estimation process described above was used for the remaining shelters and jurisdictions where data was unavailable, representing an estimated 8% of nationwide shelter intake.
Contributors
Jon Davis, manager of analytics, business intelligence and strategy
Bethany Heins, director of operations and strategic projects, Best Friends Network
Samantha Hill, data analytics specialist, business intelligence and strategy
Vicki Kilmer, director of business intelligence and strategy
Stephanie Macgill, director of foundation partnerships
Joani Ross, research coordinator, business intelligence and strategy
Brent Toellner, senior director of national programs
Peter Wolf, analyst, cat initiatives
Appendix
1 This includes any organization with a facility that has open hours, including municipal shelters, private nonprofit shelters with or without a government contract, and some rescue groups.
2 Zawistowski S, Morris J, Salman MD, Ruch-Gallie R. Population dynamics, overpopulation, and the welfare of companion animals: New insights on old and new data. Journal of Applied Animal Welfare Science (1998) 1:193–206.
3 More information is available on the Shelter Animals Count website: shelteranimalscount.org/about-the-data
4 More information is available on the Best Friends website: bestfriends.org/2025-goal
5 See the “Research Methods and Analysis” section for the save rate formula.
6 Similar to trap-neuter-return (TNR), return-to-field (RTF) programs focus on cats brought into a shelter (either by community residents or a shelter’s field services staff) as strays who lack identification (i.e., a collar with tags or a traceable microchip). Rather than house these cats only to kill most of them following the designated stray-hold period, shelters sterilize, vaccinate and return them to the outdoor location where the cats were living. RTF is sometimes called shelter-neuter-return (SNR).
7 More information is available on the Best Friends website: bestfriends.org/blogs/2018/10/04/speaking-with-one-voice-a-call-for-transparency-in-sheltering
8 See the “Research Methods and Analysis” section for definitions of gross and net intake.
9 More information is available on the Best Friends website: bestfriends.org/no-kill-2025/what-does-no-kill-mean.
10 More information is available on the Shelter Animals Count website: shelteranimalscount.org/wp-content/uploads/2022/02/BasicDataMatrix_SAC.pdf.
11 More information is available on the Shelter Animals Count website: shelteranimalscount.org/wp-content/uploads/2022/02/BasicDataMatrix_SAC.pdf
12 While a consistent standard does not yet exist in the industry for the handling of Owner-Intended Euthanasia (also referred to as Owner-Requested Euthanasia or ORE) in shelter performance rates/calculations, Best Friends has opted for a true “noses in, noses out” approach that does not exclude OREs, instead considering OREs accounted for in the 10% of allowable humane euthanasia established by the no-kill benchmark of 90%.