The State of U.S. Animal Sheltering, 2020
For more recent shelter data, check out "The State of U.S. Animal Sheltering, 2021."
The year 2020 brought significant changes for the animal welfare industry. The COVID-19 pandemic changed the way our nation’s shelters operated, resulting in an unexpected large leap forward in progress with more shelter than ever reaching the no-kill benchmark of a 90% save rate. This report shares the top-line results of the Best Friends 2020 national dataset and analysis, as well as a five-year trend of total data and specific types of intake and outcomes.
Table of Contents
- National progress indicators
- Findings by state
- Findings by region
- Findings by species
- Findings by shelter type
- Shelter data, social vulnerability and demographics
- Looking ahead
Findings: Trend Analysis (2016-2020)
- What it means for a shelter, county, state or nation to be no-kill
- Data sources in Best Friends' 2020 dataset
- The difference between gross and net intake
- How save rates are calculated
- How lifesaving gap is calculated
- Gaps in the data
Executive Summary
Significant changes began to occur in our nation’s shelters during the early weeks of the COVID-19 pandemic. Intake policies, fostering needs and adoption protocols looked different. One of the biggest questions was how long these changes would last. Thankfully, shelters and Best Friends were in a better position than ever before to document and collect data.
For nearly four decades, the animal welfare industry has been working to overhaul outmoded systems and end the needless deaths of millions of dogs and cats. Data collection has always been a challenge in this work. Recent efforts by Best Friends to collect and analyze national shelter data provide the most comprehensive look at our nation’s lifesaving gap and the amazing progress made in just the past five years.
This progress took an unexpectedly large leap forward during the pandemic. More shelters than ever reached the no-kill benchmark of a 90% save rate. The number of dogs and cats entering shelters and needlessly dying fell by the largest rate ever recorded. This report shares the top-line results of the Best Friends 2020 national dataset and analysis. In addition to national progress, the report covers specific findings by state, region, human population and species, as well as a five-year trend of total data and specific types of intake and outcomes.
By understanding national, state and regional trends, animal welfare professionals can have a benchmark by which to compare their local progress toward no-kill (i.e., achieving positive outcomes for at least 90% of the animals entering a shelter) and better understand the data tools that Best Friends has developed and made available publicly. In today’s environment of limited resources and many competing social causes, it is imperative to spend every dollar as wisely as possible. Strategic plans, resource allocation and lifesaving programs all benefit from a data-driven approach.
Note: Overall, the number of dogs and cats suffering from irremediable medical or behavioral issues that compromise their quality of life and prevent them from being rehomed typically makes up no more than 10% of dogs and cats entering the shelter system. Best Friends uses the term “lifesaving gap” and the phrase “needlessly dying in shelters” to represent progress toward that 90% save rate, which is the commonly recognized no-kill benchmark. The lifesaving gap is the difference between the current save rate and the no-kill benchmark. We use “needlessly dying in shelters” to distinguish between individual dogs and cats who lose their lives because of preventable factors, such as lack of shelter space or other resources, and those who are euthanized, which is an act of true mercy for individual animals who are sick or suffering irremediably. See the Research Methods and Analysis section for more details on defining no-kill.
As a leader in the no-kill movement, Best Friends is careful with its terminology. We refrain from referring to shelters as “kill shelters” when they have not yet achieved no-kill because it implies that the responsibility for becoming no-kill falls on one entity and the caring people within it, rather than acknowledging the need for everyone to work together to end the unnecessary deaths of homeless dogs and cats.
Key findings
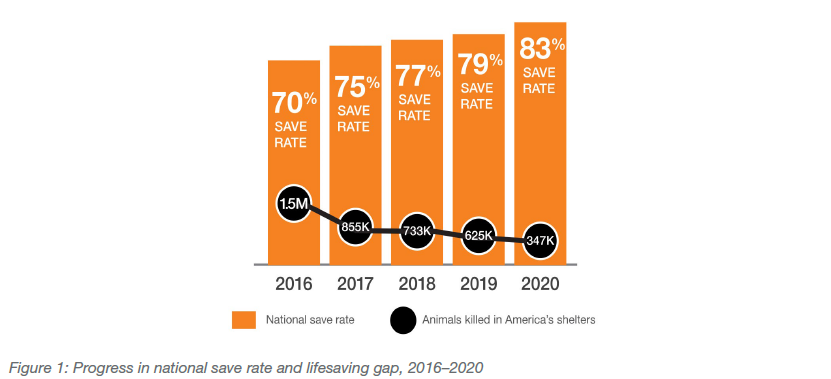
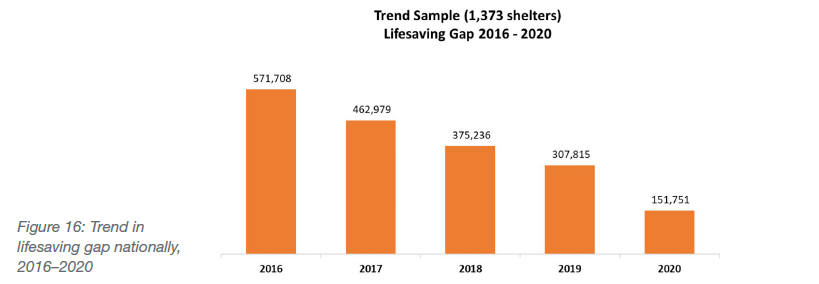
The lifesaving gap decreased more than ever in 2020.
The year 2020 ended with a lifesaving gap of 346,622 dogs and cats. While there is still work to be done, this is a 278,778 (44.6%) drop from the 625,400 dogs and cats unnecessarily losing their lives in 2019. This follows a reduction of 14.7% between 2018 and 2019.
Shelter intake plummeted during 2020.
Total shelter intake during 2020 fell by 20.5% from 2019, from 5.36 million to 4.26 million (1.9 million dogs, 1.8 million cats, and roughly 500,000 undesignated by the reporting shelter or estimated). From 2018 to 2019, intake rose by 0.2%.
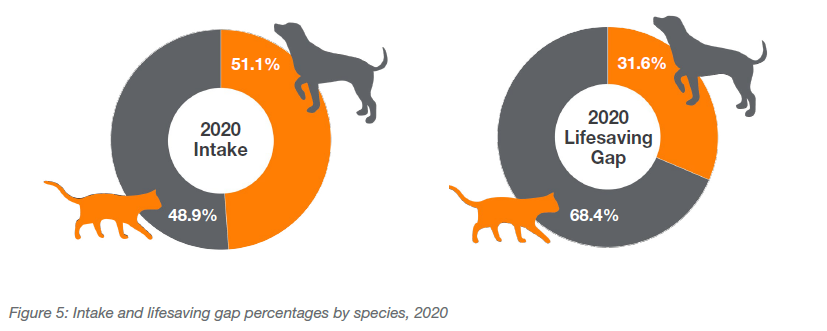
The U.S. shelter lifesaving gap is made up predominantly of cats.
More than two cats (68.4% of the lifesaving gap) are unnecessarily dying in U.S. shelters for every dog. This is happening despite dogs making up 51.1% of intake (among pets specifically reported as either a dog or a cat).
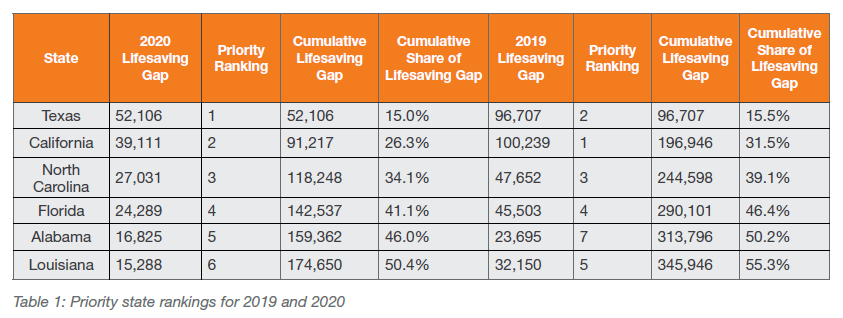
More than half of the dogs and cats who need saving are in six states.
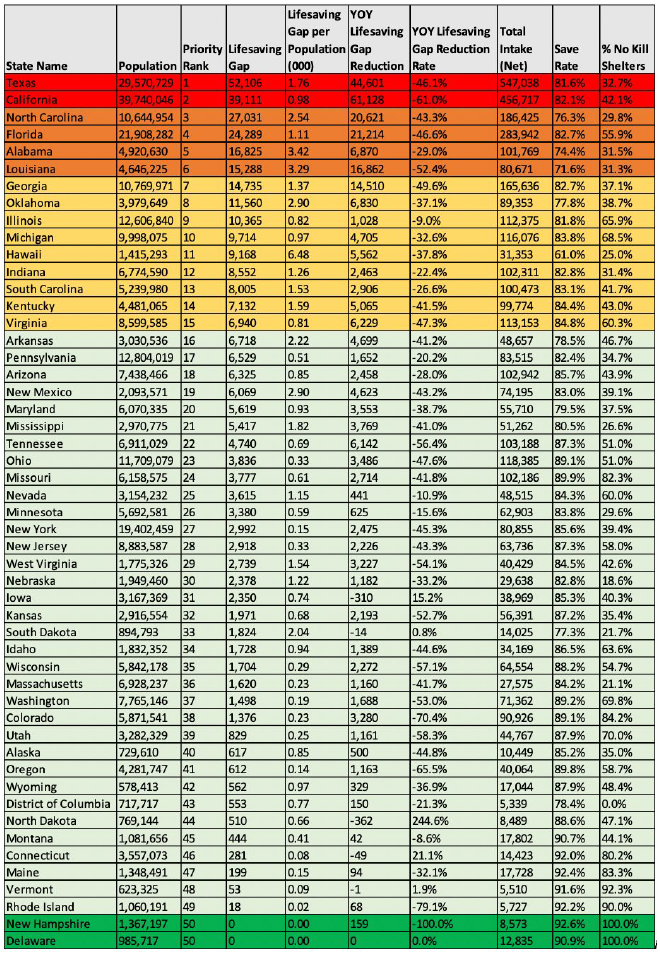
Texas (52,106), California (39,111), North Carolina (27,031), Florida (24,289), Alabama (16,825) and Louisiana (15,288) account for 50.4% of the lifesaving gap. Of the 4,404 brick-and-mortar shelters in the country, the 100 (2.3%) shelters with the largest gaps collectively account for 42.5% of the dogs and cats who still need saving.
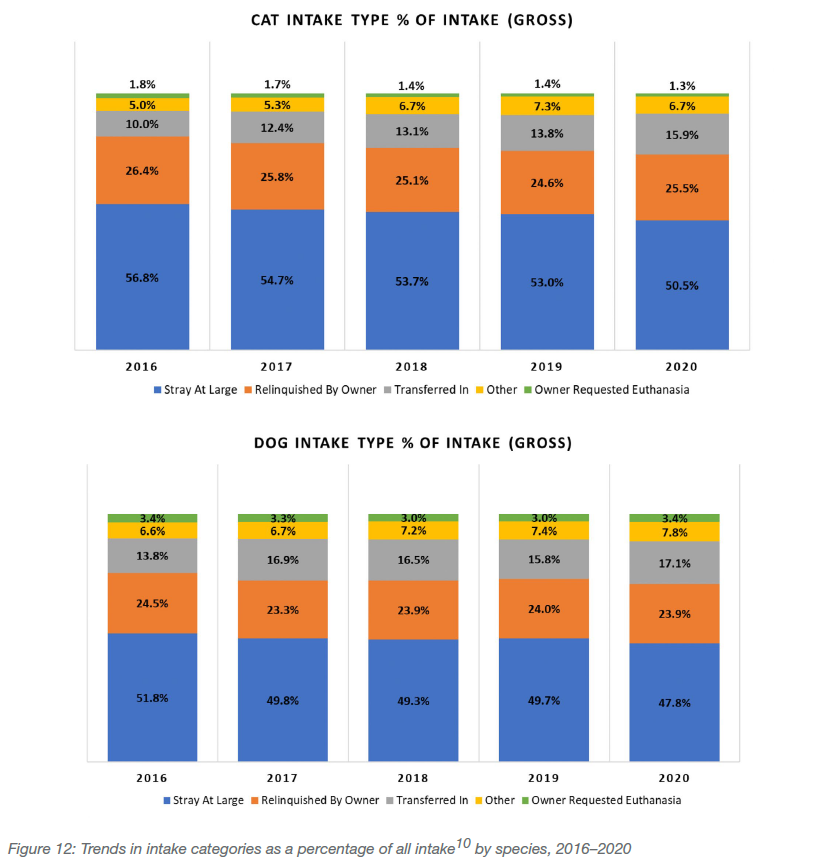
Live outcomes for dogs and cats fell significantly in 2020.
Contrary to popular narrative, fewer dogs and cats were saved from U.S. shelters in 2020. Among shelters that reported both 2019 and 2020 data, live outcomes fell by 20.6%. Included in this decrease is adoptions, which fell by 19.6%. Despite a drop in live outcomes, the national save rate for all U.S. shelters increased 4 percentage points, from 79.0% to 83.0%.
The numbers of no-kill shelters and communities continue to increase.
Shelters achieving the no-kill benchmark (a save rate of 90%) totaled 2,094, or 47.5% of all shelters nationwide. This is an increase of 3.7 percentage points from 43.8% in 2019. The number of counties achieving no-kill also rose, from 658 in 2019 to 764 in 2020. This is 32.6% of the 2,340 counties with sheltering services (807 counties do not have sheltering services). Note: See the Research Methods and Analysis section for more details on how no-kill is measured.
Human populations tell us a lot about the country’s lifesaving needs.
Roughly one dog or cat needs to be saved for every 1,000 people in the United States. While Texas and California contain more of these pets than any other state, they rank just tenth and nineteenth, respectively, in per capita lifesaving gap. Hawaii (6.5 pets per 1,000 population), Alabama (3.4) and Louisiana (3.3) have the most dogs and cats to be saved relative to the number of people who live there. Based on the U.S. Centers for Disease Control and Prevention’s Social Vulnerability Index, 28.8% of the country’s human population lives in highly vulnerable communities. These communities, however, make up half (49.8%) of the country’s lifesaving gap.
Introduction
For generations, healthy cats and dogs have been dying in our communities’ animal shelters. Until the past few years, millions lost their lives annually. For the past 35 years, the animal welfare industry has been working to overhaul antiquated systems and ways of relating to companion animals. Yet, until recently, the numbers of dogs and cats entering and dying in shelters were largely broad estimates based on limited data.
Because there is no mandated federal reporting of animal shelter performance, it is left to states and municipalities to decide if and how they want to track this data. Very few states require state-level reporting and those that do often collect data in different ways. And in states that do not require reporting, it has been left to the municipalities or the shelters themselves to define, record and track animal statistics.
The industry as a whole has been left to grapple with large data gaps, inconsistent information, disputes over definitions of terms, and a lack of clarity surrounding the number of dogs and cats unnecessarily dying in shelters each year. Even the precise number of animal shelters in the country has remained a matter of considerable speculation.
In the mid-2010s, Best Friends began to compile a database of all U.S. shelters. There were 4,404 brick-and-mortar animal shelters in the country in 20201. In addition to building and maintaining this master shelter list, Best Friends collects data about how many dogs and cats are entering these shelters, the array of outcomes for each, and how many animals need to be saved each year for that shelter and community to reach no-kill status (i.e., achieving positive outcomes for at least 90% of the animals entering a shelter).
In this report, we share the top-line results of Best Friends’ 2020 dataset analysis across four areas of interest: outcomes by species (dog and cat), per capita findings, state and regional differences, and animal sheltering trends over the past five years.
By understanding national, regional and state trends, animal welfare professionals can have a benchmark by which to compare their local progress toward no-kill and better understand the data tools that Best Friends has developed and made available publicly. In today’s environment of limited resources and many competing social causes, it is imperative to spend every dollar as wisely as possible. Strategic plans, resource allocation and lifesaving programs all benefit from a data-driven approach.
Background
Historically, animal welfare has lacked comprehensive data regarding sheltered cats and dogs. A variety of efforts have been undertaken in the past to bridge this long-standing industry gap. Some are still in progress while others have not been maintained or have been limited in their efficacy because of lack of consistency, completeness or knowledge of how best to apply the information. A number of regional efforts were conducted in the 1990s, including the California Sheltering Agencies Survey, the Iowa Federation of Humane Societies Animal Shelter Survey, and the Progressive Animal Welfare Society Report on Washington State Animal Shelter Statistics.
A national effort was initiated in 1993 with the formation of the National Council on Pet Population Study and Policy to gather and analyze data on the number, origin and disposition of companion animals (dogs and cats) in the United States. Unfortunately, only about 1,100 of the estimated 4,700 shelters responded, making it difficult to draw conclusions about intake, outcomes or national trends2.
In 2004, 20 leaders representing national organizations and funders in the industry gathered to find common ground in an otherwise divided animal welfare field. The result was the Asilomar Accords. But this effort, too, proved to be problematic in delivering consistent, non-subjective reporting standards that would allow for accurate comparative analyses. In addition, adoption of the Asilomar Accords was insufficient to provide a representative view of sheltering data nationally.
By 2010, after more than a century of animal sheltering in the United States, it was considered unacceptable that the best we could do as an industry was to estimate that millions of dogs and cats enter the nation’s shelters every year and that some large percentage of those animals do not leave alive. As a result of this widespread dissatisfaction, many of the same organizations that collaborated on the Asilomar Accords and others worked together to create the Basic Data Matrix3, which currently serves as the industry standard regarding the minimum amount of data that shelters should be collecting and reporting annually.
In 2012, Best Friends joined with these same organizations, collaborating in the creation of Shelter Animals Count (SAC), a national database of self-reported data to serve as the most credible and complete source of data on sheltered animals for the industry — a critical dependency for our mission advancement and assessment.
By 2016, however, Best Friends was narrowing its strategic focus with the ambitious goal of leading the country to no-kill by 2025. This goal required more complete and representative shelter data than SAC had accumulated through its voluntary data reporting. So, in late 2016, Best Friends began its first data collection effort to augment the available industry data and apply an estimation methodology for missing data (see the Research Methods and Analysis section for more information), thereby creating the most comprehensive national dataset to date. In July 2019, Best Friends introduced our public-facing pet lifesaving dashboard4 for publishing national, state, community and shelter-level data for calendar year 2018.
In June 2021, the pet lifesaving dashboard was updated with the 2020 dataset, the third annual dataset to be displayed publicly by Best Friends. This update made the dashboard the most complete compilation of sheltering data in the industry, including calendar-year data from 3,330 brick-and-mortar shelters. This latest dataset represents 76% of the 4,404 shelters in the country and accounts for an estimated 93% of the dogs and cats entering U.S. shelters in 2020. A total of 2,340 of the 3,147 counties have sheltering services, and 1,529 of those are fully accounted for with collected data. For the remaining 811 counties with sheltering services, the data is either a combination of collected data and estimation or entirely an estimation.
The growing no-kill movement and the importance of transparency
A decade ago, there were fewer than 10 counties known to have achieved the recognized no-kill benchmark of a 90% save rate5. For a county to be no-kill, every shelter located within it must reach this benchmark. Today, thanks to considerable lifesaving progress and improved data collection, we know that there are 764 no-kill counties and two no-kill states, Delaware and New Hampshire.
Reporting on what has been accomplished is encouraging, to be sure, but the impetus behind data collection efforts has less to do with looking back than with looking ahead. This comprehensive dataset now available allows for an increasingly detailed map of the work that needs to be done to achieve no-kill by 2025. With a better understanding and identification of the remaining hot spots, collective resources can be better deployed for the greatest lifesaving impact by targeting programs more precisely. This ongoing data collection and analysis allow for program impact measurement, progress tracking and the identification of areas in further need.
Transparency is central to the no-kill philosophy and to the effective implementation of no-kill programs. Like any industry, the animal welfare field is ill-equipped to solve a problem if we cannot define the nature of that problem. And community members — whose engagement is essential for lifesaving progress — cannot help solve a problem they do not know exists.
Animal shelter transparency begins with the reporting of simple numbers: the number of dogs and cats who entered a shelter in a given time period, the number of animals with positive outcomes (e.g., animals who were adopted, animals returned to their owners, community cats returned to the field6) and the number of animals with negative outcomes (e.g., animals who died, were lost in care or were euthanized). The more detailed the data, the more accurately programs can be targeted to particular needs, evaluated for efficacy and refined.
In October 2018, Best Friends was proud to co-author a landmark position statement jointly issued by eight of the nation’s leading animal welfare organizations and foundations. Calling upon every organization in the country that takes companion animals into their care to share their data, Best Friends — along with the American Society for the Prevention of Cruelty to Animals, Michelson Found Animals Foundation, the Humane Society of the United States, Maddie’s Fund, PetSmart Charities, Petco Love (formerly Petco Foundation) and the WaterShed Animal Fund — issued the following joint statement of shared commitment to transparency:
“As national leaders and funders of animal welfare in North America, we believe that organizations should be transparent about the number of animals that come under their care, and the outcome for all of those animals. That is why we support the public availability of key data (the basic data matrix as defined by Shelter Animals Count) from all animal welfare agencies and nonprofits, both publicly and privately funded and whether or not they provide government animal control services or humane law enforcement.”7
Findings: 2020 Details
Our 2020 dataset demonstrates the significant lifesaving progress that can be made by managing intake. The COVID-19 pandemic caused many shelters to change how they operate, resulting in fewer dogs and cats entering shelters and even fewer animals dying. This happened despite decreases in live outcomes. While increasing live outcomes is a valuable tool for helping to reduce the number of animals dying in shelters, it is not the only tool available to shelters committed to achieving the no-kill benchmark.
National progress indicators
The 4.26 million dogs and cats who entered shelters in 2020 represents a decrease of 20.5% from 2019’s 5.36 million. This is a dramatic change from the slight increase from 2018 to 2019. Of these pets, 1.9 million were dogs, 1.8 million were cats, and roughly 500,000 were undesignated by the reporting shelter or estimated. This change in intake, coupled with the implementation of new lifesaving policies, helped lead to significant lifesaving progress in 2020:
- The total number of dogs and cats unnecessarily dying in shelters decreased by 44.6%, from 625,400 to 346,622.
- The national save rate increased by 4 percentage points, from 79.0% to 83.0%.
- The 2,094 no-kill shelters represent an increase of 3.7 percentage points, to 47.5% of all U.S. shelters.
- No-kill counties total 764, up from 658 in 2019, or 32.6% of all counties with sheltering services.
Note: Please see the Research Methods and Analysis section for definitions of these metrics.
In 2016, Best Friends declared a goal of helping the country to reach no-kill by 2025. As shown in Figure 1, significant progress has occurred since then.
Findings by state
In recent years, five states accounted for more than half of the nation’s lifesaving gap. By prioritizing help for the states with the most dogs and cats needlessly dying in shelters, Best Friends can have the greatest lifesaving impact. In 2020, as the lifesaving gap fell by 44.6%, that number of states rose from five to six. Texas is the state with the largest lifesaving gap (see Table 1), a reduction of 46.1% from 2019. California, the top state in 2019, is now second, with a reduction of 61.0% from 2019. North Carolina, Florida, Alabama and Louisiana are the other states that account for half of the pets unnecessarily dying in U.S. shelters, but they all have reduced their lifesaving gaps by 29.0% or more.
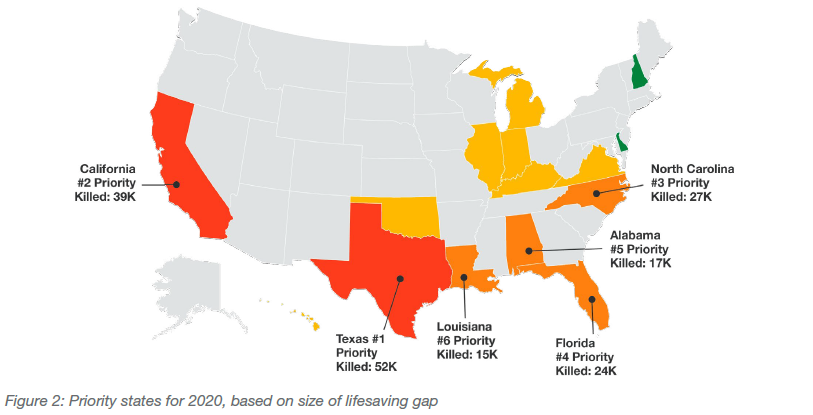
The top six states for 2020 have a combined lifesaving gap of 174,650 pets, or 50.4% of the nation’s total. These six states, along with the nine states shown in yellow in Figure 2, account for more than 75% of the pets nationwide in need of saving.
Other state-level highlights from the 2020 dataset:
- New Hampshire joins Delaware as the nation’s second no-kill state.
- Rhode Island and Vermont are very close to becoming no-kill, with a combined lifesaving gap of just 71 dogs and cats.
- In 21 states, more than half of the shelters have reached the no-kill benchmark of a 90% save rate.
- Seven states (Delaware, New Hampshire, Rhode Island, Maine, Connecticut, Vermont and Montana) have aggregated save rates of at least 90%, but these states, except for Delaware and New Hampshire, do still have a lifesaving gap because some shelters are not yet no-kill.
- Hawaii’s 61.0% save rate is the only one below 70%.
- Hawaii’s lifesaving gap per human population is the highest in the nation, at 6.5 pets per 1,000 humans. (See Table 2.)
- In 33 states, the number of dogs and cats needlessly dying in shelters is below 1 per 1,000 human population. (See Table 2.)
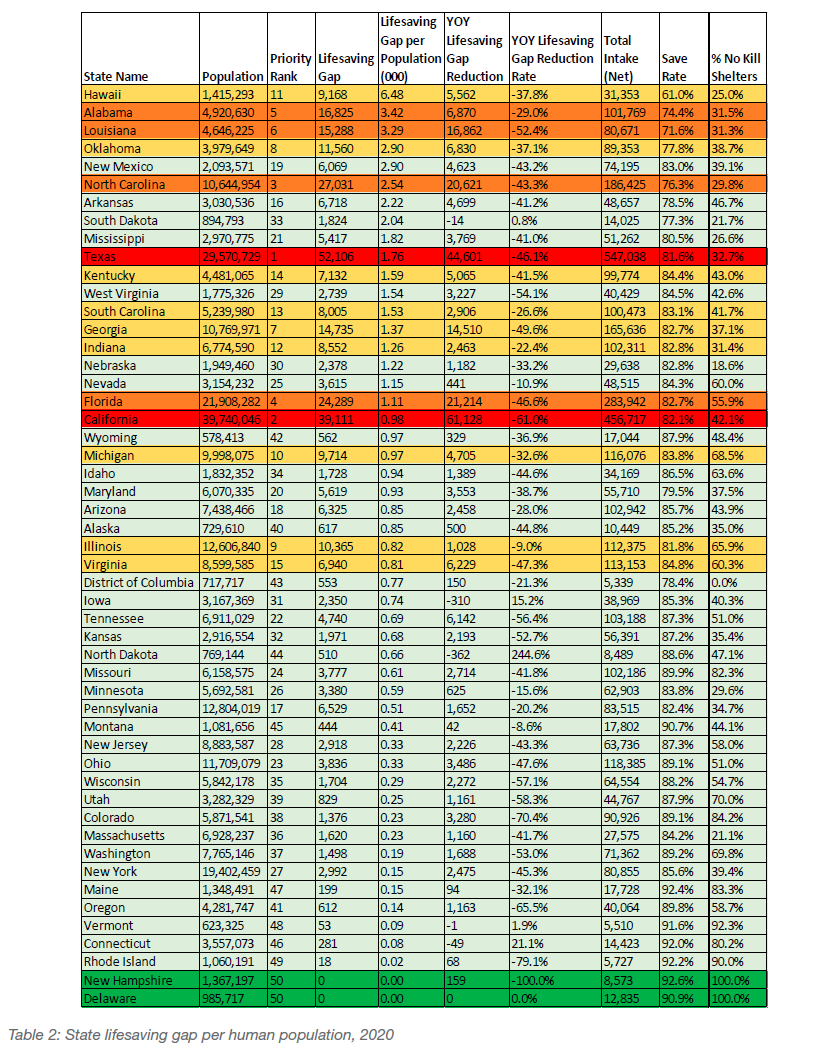
Note: This table sorted by lifesaving gap can be found in the appendix.
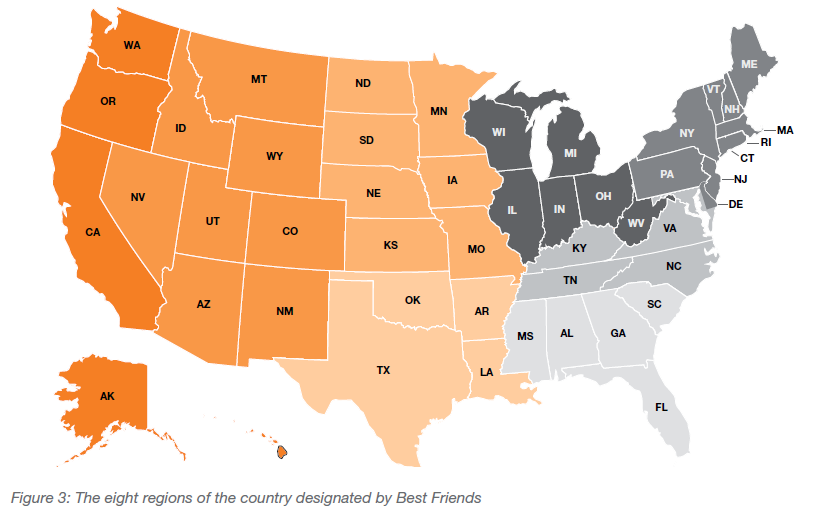
Findings by region
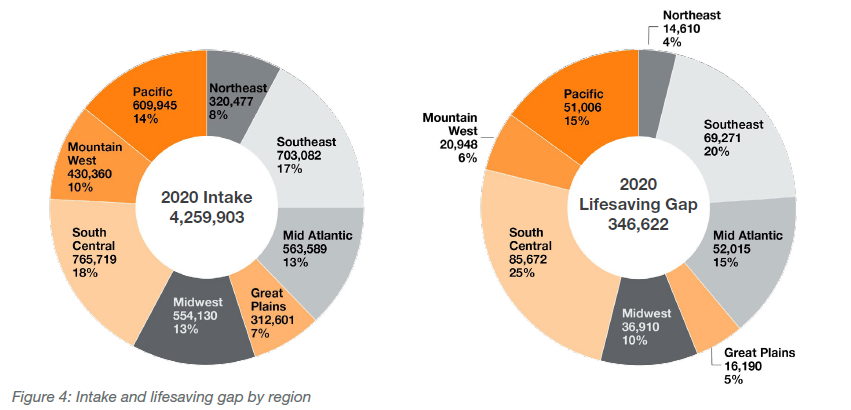
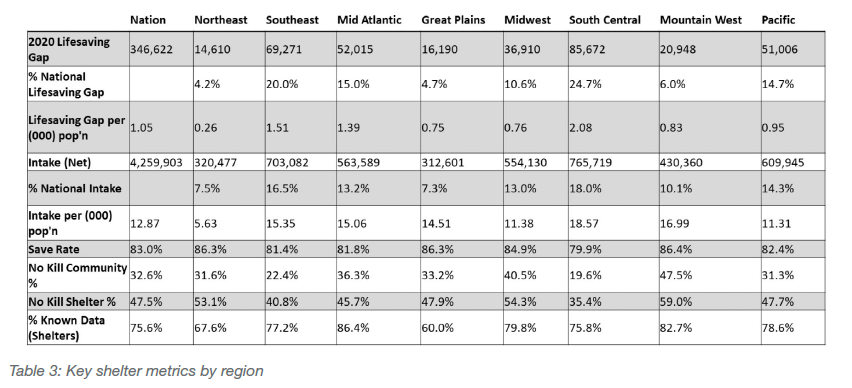
Best Friends has divided the country into eight regions for programming and strategy implementation (Figure 3). Of the 4,404 brick-and-mortar shelters in the United States, 100 (2.3%) account for 42.5% of dogs and cats needlessly dying in shelters. The 2020 dataset reveals several important regional differences (see Figure 4), including:
- The South Central region continues to account for the largest national share of both intake (18.0%) and lifesaving gap (24.7%).
- For lifesaving gap per 1,000 population, the South Central (2.08), Southeast (1.51) and Mid-Atlantic (1.39) regions are all higher than the nation in aggregate (1.05).
- At 59.0%, the Mountain West region has the highest rate of shelters reaching the no-kill benchmark. In the Midwest (54.3%) and the Northeast (53.1%), most of the shelters have reached a 90% save rate.
- The South Central (-72,992) and Pacific (-70,041) regions had the largest reduction in lifesaving gap and experienced the largest leaps in save rate, at +5.7 and +5.5 percentage points, respectively.
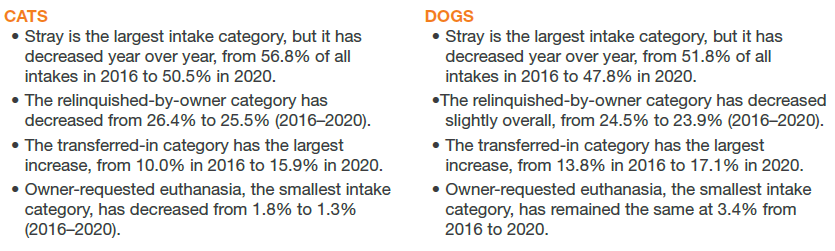
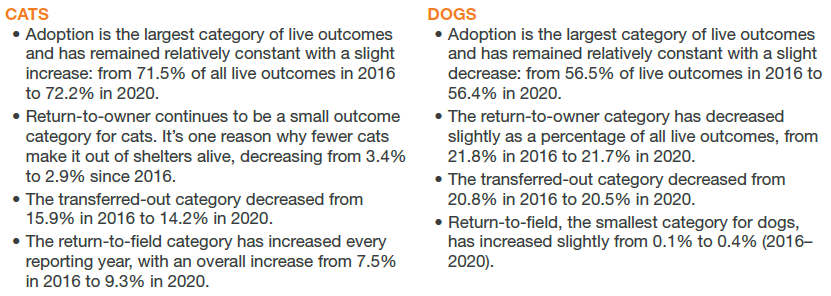
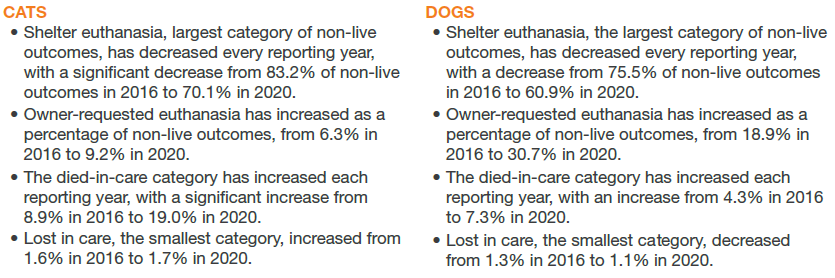
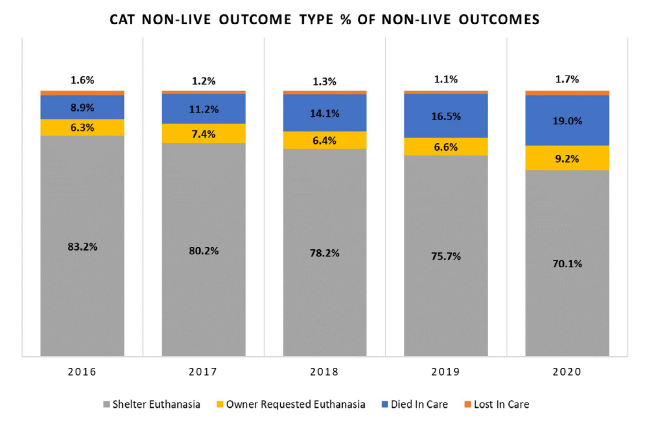
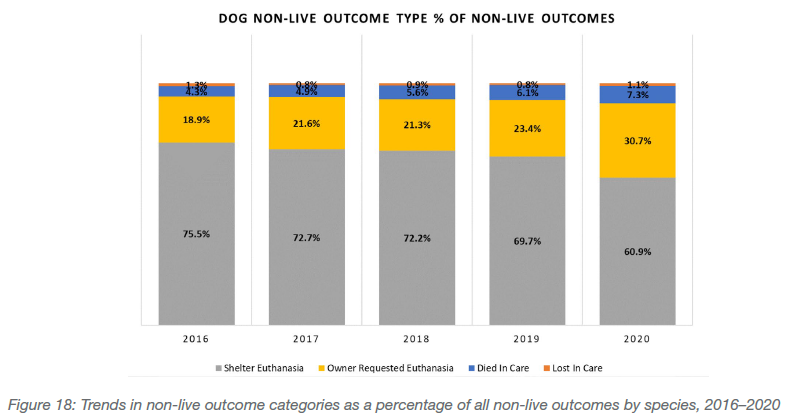
Findings by species
The 2020 dataset reveals some important differences between the outcomes for dogs and cats based on the 3,299 shelters that reported species-specific data. Some of those differences are:
- Cats make up 68.4% of the national lifesaving gap, down slightly from 69.1% in 2019.
- Even though dogs make up more than half (51.1%) of shelter intake, cats make up most of the lifesaving gap — at a ratio of more than 2:1 over dogs. This is down 1.3 percentage points from 2019.
- The national aggregate save rate for dogs is 87.6%, an increase of 2.4 percentage points from 2019. The cat save rate had a greater increase (5.8 percentage points), but is still behind dogs at 80.3%.
- Cats make up most of the lifesaving gap in 40 states.
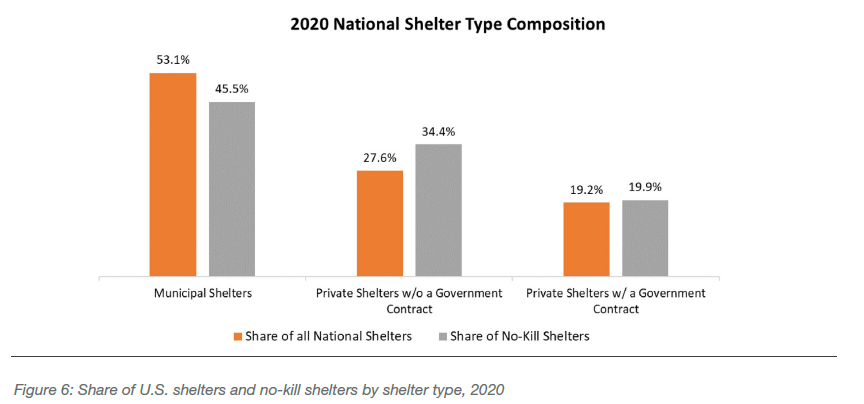
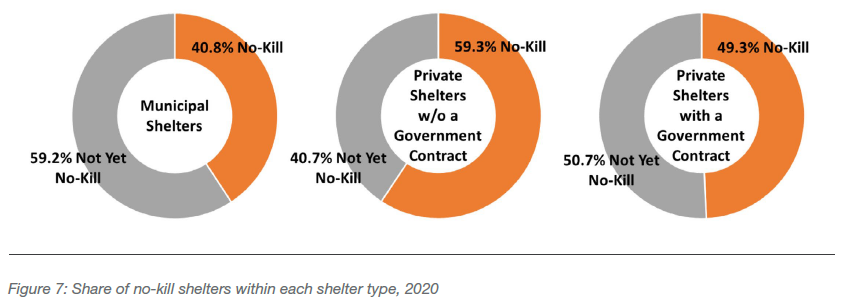
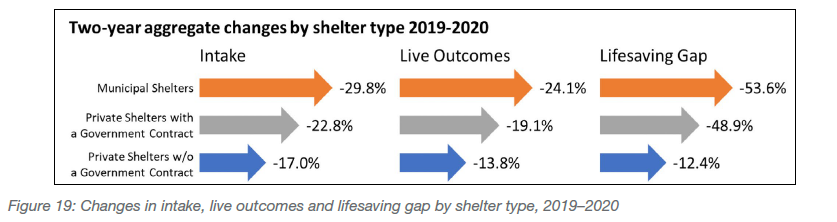
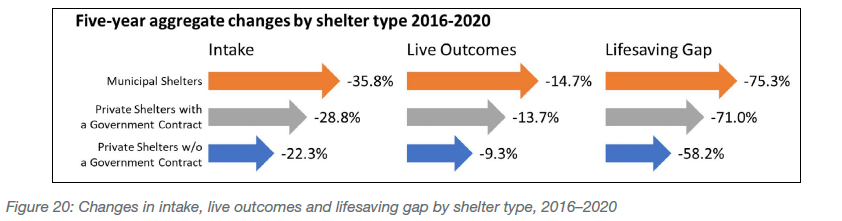
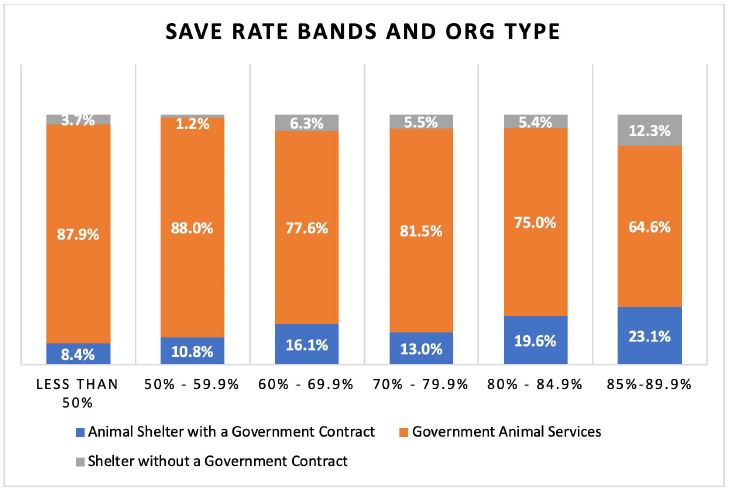
Findings by shelter type
More than half of the 4,404 shelters in the country are municipal shelters, but they are disproportionately not yet no-kill. Private shelters without a government contract were more likely to be at the no-kill benchmark in 2020 (see Figure 6). Figure 7 shows the share of no-kill shelters within each shelter type.
Note: Within the 2020 national dataset, there are five rescue organizations (groups with hours open to the public but without a brick-and-mortar facility) that hold government contracts, of which three are no-kill.
Shelter data, social vulnerability and demographics
The communities in which dogs and cats are most vulnerable tend to be those where people are the most vulnerable. The Social Vulnerability Index8 (SVI), developed by the U.S. Centers for Disease Control and Prevention to measure a community’s ability to respond to stresses and disasters, indicates that 28.8% of the country’s human population lives in high vulnerability counties (SVI percentile of 70 or greater). These communities make up 49.8% of the U.S. shelter lifesaving gap. The pets who are needlessly dying are more likely to be in communities where people have less access to critical quality-of-life services and are more at risk to the impact of economic crises and natural disasters.
Sheltering services within high vulnerability communities contrast with low vulnerability communities (SVI percentile of 30 or below) in several key ways (see Figure 8). Even though more dogs and cats enter shelters in high vulnerability communities as strays, fewer are being adopted back into these communities or returned to their owners. A lower rate of owner surrender in high vulnerability communities further highlights that not everyone is engaged in the sheltering process in the same way.
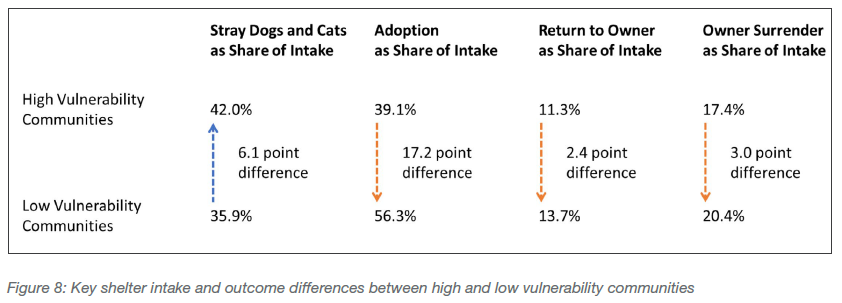
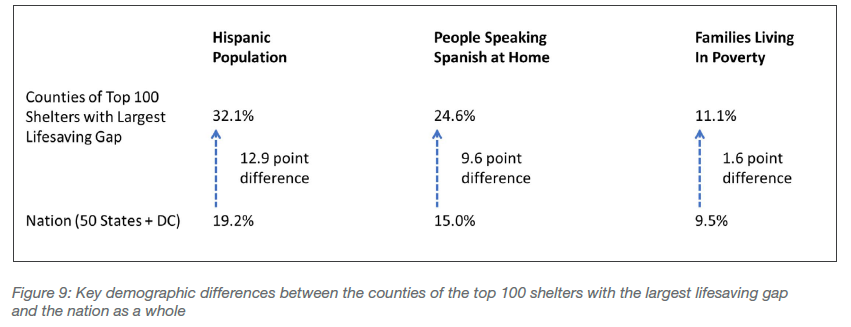
Overlaying demographics9 with shelter data highlights more specific differences between communities with the most pets needlessly dying in shelters and the rest of the country (see Figure 9). The communities with the largest lifesaving gaps skew more toward Hispanic populations, Spanish speakers and those living in poverty. Given the significant link between human vulnerability and pet vulnerability, this data shows that the animal welfare industry must understand both the human elements associated with pets in need and the importance of including all people in sheltering practices.
Reaching no-kill in every shelter and every community will require particular focus on those that have been systemically left behind in services that extend far beyond animal sheltering. Policies and programs cannot further the marginalization of people in these communities if we wish for their help in reducing the country’s lifesaving gap. Taking steps toward inclusion will save the lives of dogs and cats from these underleveraged communities.
Looking ahead
Undoubtedly, the COVID-19 pandemic dramatically impacted the sharp reduction in intake and unnecessary deaths in shelters in 2020. It would be easy to assume that once the pandemic abates, intake and deaths will revert to pre-pandemic levels. This may be an overly cynical view.
Because of the dramatic disruptions caused by the pandemic, many shelters implemented changes that will likely have sustained impact on shelter populations. One of the changes is appointment based managed intake programs, which could result in a permanent reduction in pets entering shelters. And when shelters called on their communities for help, community members stepped up to foster pets. Shelters became more innovative and found new ways to connect pets with adopters in their communities. In many shelters, leadership realized that they had more ability and support for changing shelter policies than they previously thought.
While reopening the country after the pandemic will likely lead to an increase in pets coming into shelters, Best Friends does not anticipate a return to 2019 numbers, since many of the new programs and forms of community support will remain fixtures in the shelter environment for years to come. And while we are forecasting an increase in shelter intake for 2021 (and that forecast will remain well below 2019 numbers), we are also forecasting a continued reduction in animals unnecessarily dying in shelters.
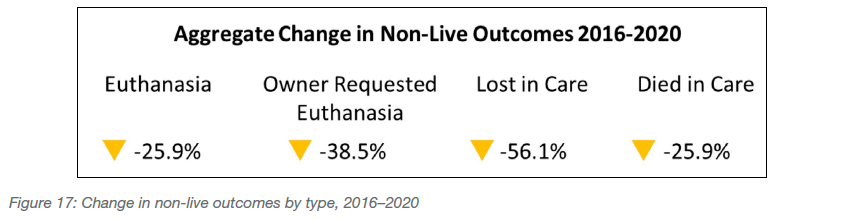
Findings: Trend Analysis (2016-2020)
The sample used for trend analysis
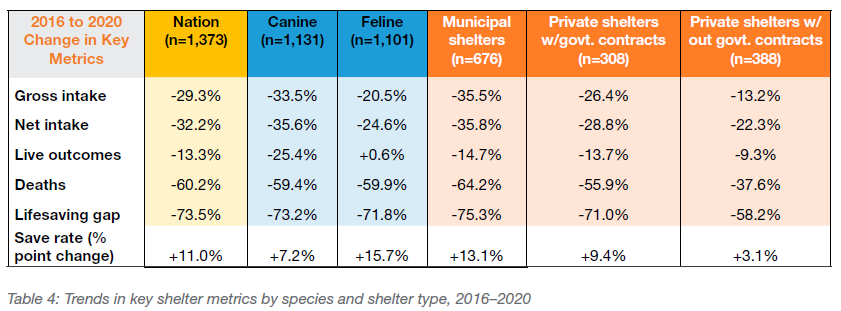
The basis for analyzing sheltering trends is data collected from 1,373 brick-and-mortar shelters that reported data consistently over the past five years (2016–2020). This sample makes up 53.9% of the national intake in the 2020 national dataset and is used to isolate true trends by excluding changes in data collection and estimation rates. The resulting trends could then be used to provide overall insight and differences observed by organization type, region and species. It is important to note that Best Friends Network partners are over-represented in this sample at 52.3% of all shelters, compared to 35.3% in the national dataset.
A total of 1,131 organizations in this sample have year-over-year dog data and 1,101 have year-over-year cat data. These two samples serve as the basis for species-level findings. (See Table 4.) Because of limitations in shelter reporting, smaller samples are used to analyze trends in intake and outcome subtypes. The general subtype sample of five years of data for all species is 754 organizations, with 675 specifically for dogs and 695 for cats.
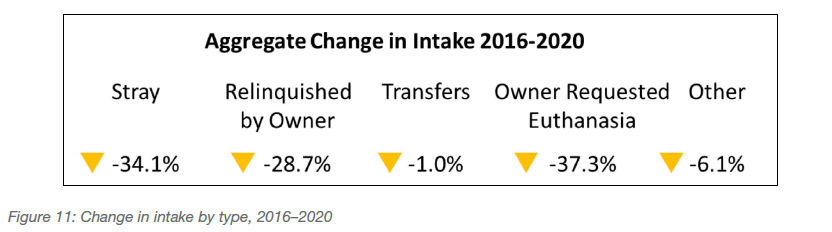
Intake
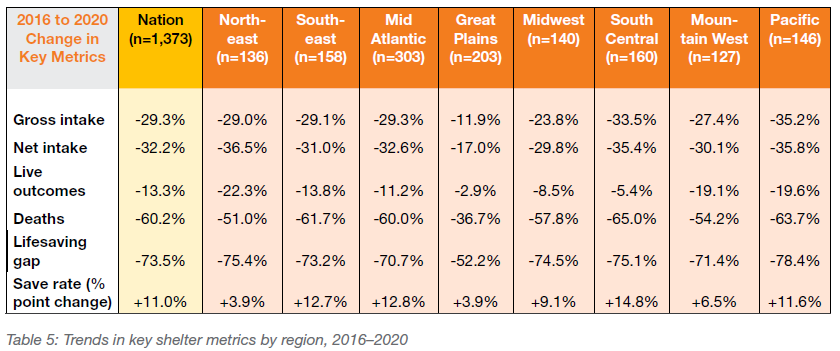
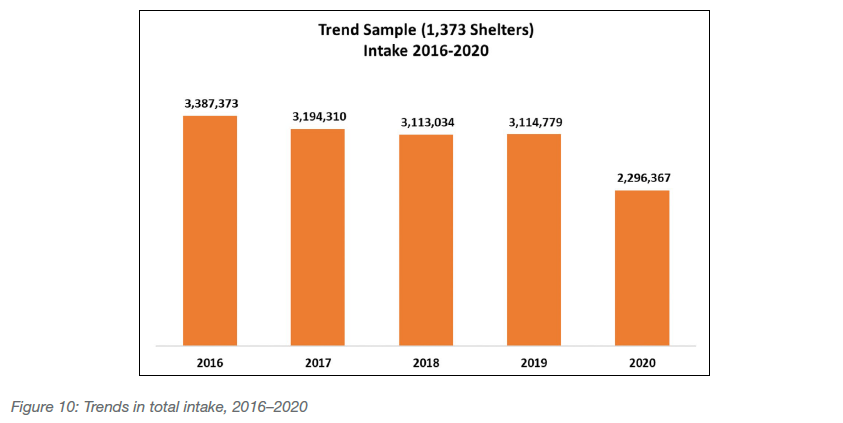
Between 2016 and 2020, intake decreased by 32.2%. The largest drop in this sample occurred in 2020 with a decrease of 26.3% from 2019. Intake has fallen since 2016 for all regions, ranging from 36.5% in the Northeast to 17.0% in the Great Plains region. (See Table 5.)
Conclusions
Analysis of the 2020 dataset shows the magnitude of changes in U.S. sheltering during the COVID-19 pandemic. Changes in intake policy and services became a reality for many shelters during the pandemic.
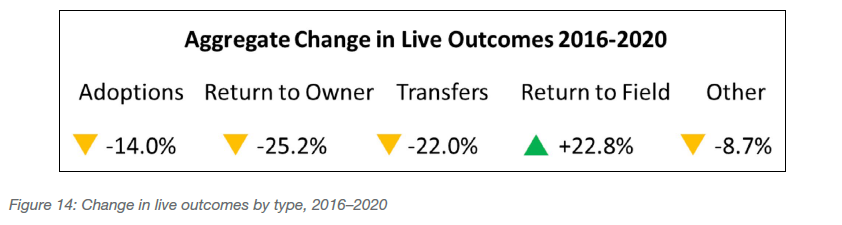
The intake decrease of 20.5%, the most significant change in intake since Best Friends has been tracking U.S. shelter data, led to dramatically different levels of outcomes. The national lifesaving gap fell from 625,400 to 346,622, a drop of 44.6%. As a result of fewer dogs and cats in shelters, live outcomes dropped 20.6%, with adoptions 19.6% lower than in 2019. All of this combined into a national aggregate save rate increase of 4 percentage points, from 79.0% to 83.0%. The lifesaving emphasis on cats has not changed because more than two cats to every dog (68.4%) are unnecessarily dying in U.S. shelters.
It is the hope of Best Friends that this report will help shelters, policymakers, animal welfare advocates and other stakeholders identify and implement lifesaving programs to save more pets in their communities. Great progress was made in 2020, but there are many dogs and cats who still need to be saved.
Research Methods and Analysis
The descriptions and definitions provided here are in keeping with Best Friends’ commitment to transparency and desire for those in animal welfare and public policy to better understand the data.
What it means for a shelter, county, state or nation to be no-kill9
A no-kill community acts on the belief that every dog and cat deserves to live — and focuses on saving lives through pet adoption, transfer and transport, trap-neuter-return, return-to-field and other community support programs. While achieving a certain percentage of lives saved is not the goal, a quantitative benchmark can help guide lifesaving efforts. Saving 90% or more of the dogs and cats who enter shelters is the current benchmark for no-kill.
For a community to be considered no-kill, each of the brick-and-mortar animal shelters located in or servicing that community must be at a 90% save rate or higher for the animals in their care (i.e., dogs and cats combined). “Community” is defined as a U.S. county. In addition, Best Friends must have access to the data for each of these brick-and-mortar shelters.
While the 90% benchmark offers a meaningful measurement by which to gauge the progress of shelters and communities, we recognize that there may be special circumstances in which a community could be successfully implementing no-kill principles and practices but not reach a 90% save rate. These instances are uncommon and are evaluated on an individual basis to determine whether a no-kill exemption is appropriate.
Data sources in Best Friends’ 2020 dataset
Data is compiled from all brick-and-mortar shelters for which calendar year 2020 data was available (or CY 2019 where CY 2020 wasn’t provided, and likewise using CY 2018 data where more recent data wasn’t available). Data fields are collected consistent with the Basic Data Matrix industry standard11 and include the following for dogs and cats (data for other species is not collected at this time):
- Live intake: stray/at-large, relinquished by owner, owner-requested euthanasia, transferred in from an agency or other intakes
- Outcomes: adoption, returned to owner, transferred to another agency, returned to field (for community cats), other live outcome, died in care, lost in care, shelter euthanasia or owner requested euthanasia
The master shelter list is an evolving list because shelters open and close all the time. It was compiled through manual research, state by state and county by county, to find all organizations with a physical location that admit and house dogs and cats. Additional research was then conducted to identify the service area coverage for all organizations.
Sources for shelter data include public websites, government-provided data and public records requests, voluntary data submissions, and Shelter Animals Count (SAC) data that is self-reported by an organization that has opted in to a Best Friends–led coalition. Organizations that operate multiple locations or shelters may choose to report their data in aggregate or broken down by location. Their information is presented on the pet lifesaving dashboard (bestfriends.org/2025) as it is reported to us. For SAC-derived data, SAC specifically disclaims all responsibility for any analysis, interpretations, conclusions and opinions contained in the information presented in the map. While Best Friends attempts to validate data sources, we cannot guarantee the accuracy of these sources.
Each data record represents a geographical area, usually an area circumscribed by the county/FIPS code, the unique official code given to each county by the U.S. Census Bureau. This data was collected through the sources listed above and may or may not have included all shelters in that geographical area. Statewide datasets were compiled from these county-level records.
Data from counties for which all shelter data could be collected was used to develop a regional per capita rate for intake and lifesaving gap. To account for counties where data was incomplete or missing entirely, a conservative estimation factor was then applied to the known data, thereby minimizing the likelihood of underestimating the national lifesaving gap. The estimation methodology was formulated by the Best Friends business intelligence and strategy team in consultation with an outside research advisor and economist. Using the master shelter list, this rate was applied to areas lacking complete shelter data as follows:
- If there are no brick-and-mortar shelters in the master shelter list, the county was considered a non-service area and no estimation factor was applied;
- If none of the shelters in a county have verified data, the estimation factor was used for the entire county; and
- If some (but not all) shelter data is known for a county, a modified estimation factor was added to the known data to account for the unknown data.
The difference between gross and net intake
Gross intake is the total number of live intakes at a shelter and is used for shelter-level data. Net intake, or total intake minus transfers, is used for any level of aggregation beyond the shelter level as a way to avoid the double-counting of transferred dogs and cats.
How save rates are calculated12
For all individual shelters, a gross save-rate calculation is used:
(Live Intakes – Died in Care – Lost in Care – Shelter Euthanasia – Owner-Requested Euthanasia) / (Live Intakes)
At the state and national levels, a net save-rate calculation is used because it is important to remove transfers between agencies, thereby avoiding the double-counting of these animals:
(Live Intakes – Transfers In – Died in Care – Lost in Care – Shelter Euthanasia – Owner-Requested Euthanasia) / (Live Intakes – Transfers In)
How lifesaving gap is calculated
Shelter outcomes in which dogs and cats are not leaving the shelter alive include died in care, lost in care, shelter euthanasia and owner-requested euthanasia. In recognition of the no-kill benchmark of a 90% save rate, Best Friends uses the following calculation to determine the lifesaving gap in a shelter:
(Died in Care + Lost in Care + Shelter Euthanasia + Owner-Requested Euthanasia) – (0.10 × Gross Live Intake)
The total lifesaving gap of a county, state or nation is the sum total of lifesaving gaps of individual shelters.
Gaps in the data
For 2020, Best Friends has data from 3,330 brick-and-mortar shelters nationwide, 76% of the total number of those identified in our master shelter list. Because our data collection process focuses on high-volume and municipal shelters, the combined intake of collected data is much higher — estimated to account for 93% of total nationwide shelter intake. The estimation process described above was used for the remaining shelters and jurisdictions where data was unavailable, representing an estimated 7% of nationwide shelter intake.
Contributors
Janice Dankert, statistics specialist, business intelligence and strategy
Jon Davis, manager of analytics, business intelligence and strategy
DeVon Farago, manager of statistics and insights, business intelligence and strategy
Bethany Heins, director of strategy and network operations
Samantha Hill, data analytics specialist, business intelligence and strategy
Vicki Kilmer, director of business intelligence and strategy
Stephanie Macgill, director of development strategy and foundation partnerships
Joani Ross, research coordinator, business intelligence and strategy
Kayla Sebo, manager of network communications
Brent Toellner, senior director of national programs
Peter Wolf, analyst, legislation and advocacy
Appendix
Lifesaving Gap Ranked by State
Save Rate Bands Distribution in 2020
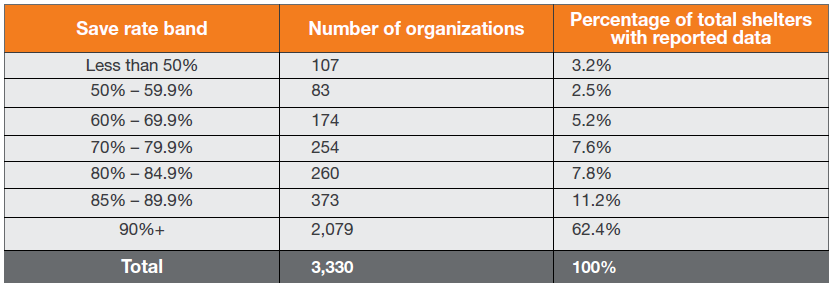
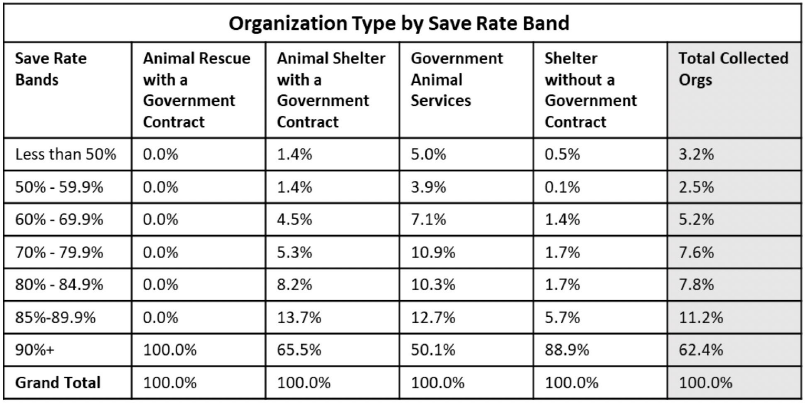
Organizations in the 2020 national dataset were grouped by their save rates (gross). Outside of the 90%+ save rate band (which accounts for 62.4% of all collected data organizations), the nearly-no-kill save rate band (85% to 89.9%) has the highest percentage of collected organizations (11.2%).
Government animal services organizations account for the majority of shelters in the collected dataset (56.9%) and 76.1% of non-no-kill shelters. Government animal services organizations also account for a disproportionate percentage of organizations in save rate bands of less than 80%, while shelters with a government contract are more concentrated in the higher-than-80% bands.
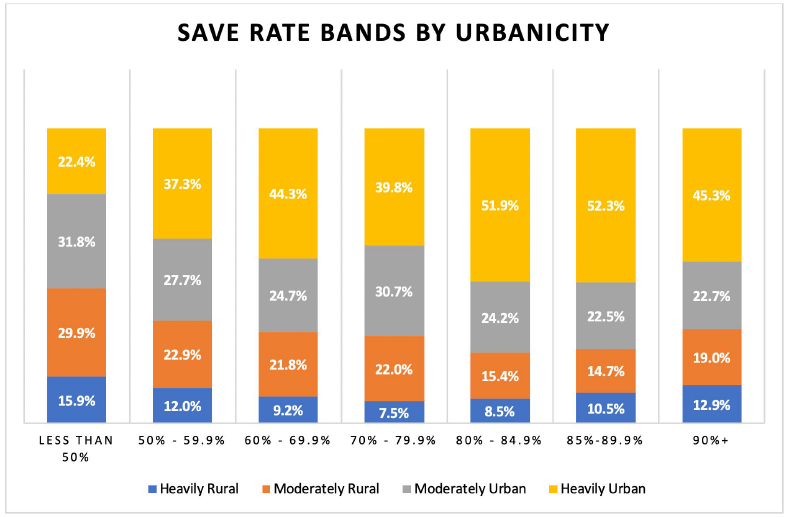
Shelters with save rates of less than 50% skew to the rural end of the urban/rural spectrum, while shelters in the 80% to 89.9% bands skew more to the urban end.
The State of U.S. Animal Sheltering, 2019
Footnotes and References
1This includes any organization with a facility that has open hours, including municipal shelters, private nonprofit shelters with or without government contracts, and some rescue groups.
2Zawistowski S, Morris J, Salman MD, Ruch-Gallie R. Population dynamics, overpopulation, and the welfare of companion animals: New insights on old and new data. Journal of Applied Animal Welfare Science (1998) 1:193–206.
3More information is available on the Shelter Animals Count website: shelteranimalscount.org/about-the-data
4More information is available on the Best Friends website: bestfriends.org/2025
5See the Research Methods and Analysis section for the save rate formula.
6Similar to trap-neuter-return (TNR), return-to-field (RTF) programs focus on cats brought into a shelter (either by community residents or a shelter’s field services staff) as strays who lack identification (i.e., a collar with tags or a traceable microchip). Rather than house these cats only to euthanize many of them following the designated stray-hold period, shelters sterilize, vaccinate and return them to the outdoor location where the cats were living. RTF is sometimes called shelter-neuter-return (SNR).
7More information is available on the Best Friends website: bestfriends.org/blogs/2018/10/04/speaking-with-one-voice-a-call-for-transparency-in-sheltering
8Methodology on the Social Vulnerability Index and downloadable raw data is available from the U.S. Centers for Disease Control and Prevention: atsdr.cdc.gov/place-health/php/svi/
9Demographics are based on Claritas 2021 Pop-Facts projections.
10Total intake in these calculations is based on aggregate gross intake, which includes transfers between organizations. See the Research Methods and Analysis section for an explanation of the difference between gross and net intake.
11More information is available on the Shelter Animals Count website: shelteranimalscount.org/wp-content/uploads/2022/02/BasicDataMatrix_SAC.pdf
12While a consistent standard does not yet exist in the industry for the handling of owner-requested euthanasia (ORE) in shelter performance rates and calculations, Best Friends has opted for a true “noses in, noses out” approach that does not exclude OREs, instead considering OREs accounted for in the 10% of allowable humane euthanasia established by the no-kill benchmark of 90%.