The State of U.S. Animal Sheltering, 2021
After an unprecedented year of lifesaving gains in 2020 brought the national save rate to 83%, the data does show that 2021’s post-pandemic challenges contributed to an increase in the number of healthy or treatable dogs and cats dying in shelters. However, while the loss of one healthy or treatable animal is one too many, the increase in lives lost was not as dramatic as many feared - going from 347,000 to 355,000.
The Best Friends national dataset includes statistics from 80% of the more than 4,000 brick-and-mortar shelters in the country, covering an estimated 94% of all dogs and cats who entered shelters in 2021.
Community differences: urban/rural and social vulnerability
Sustainability of 90% save rate
National and species trends
Shelters in the U.S. finished 2021 with a lifesaving gap of 355,000 cats and dogs, which was slightly higher than the lifesaving gap in 2020 (347,000). This increase was a result of adoptions and other live outcomes not increasing at the same rate as intake.
| The nation’s lifesaving gap of 355,000 is made up of 68% cats and 32% dogs, roughly 240,000 cats and 115,000 dogs. | 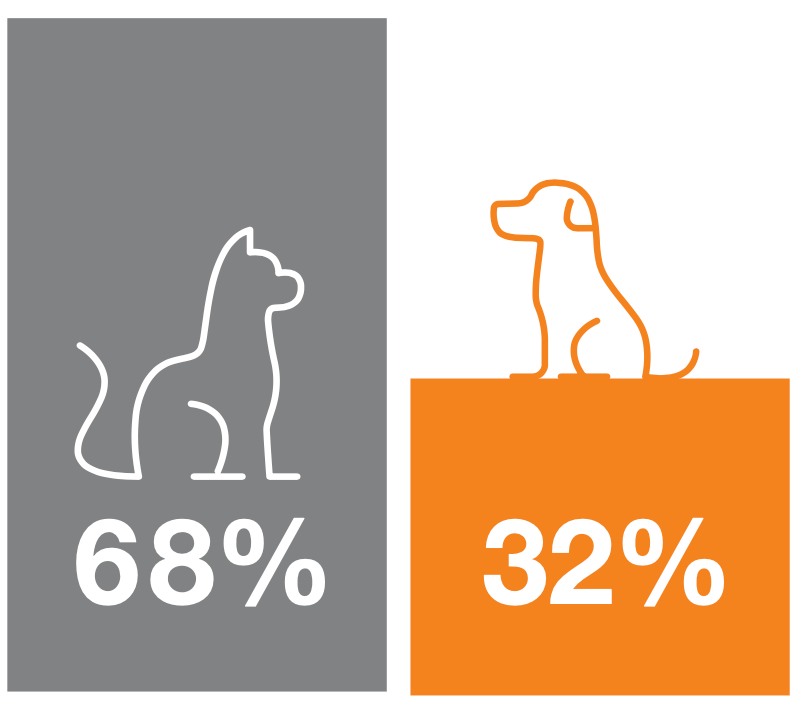 | The nation’s 2021 intake was 4.6 million, split almost equally between dogs and cats. (From 2016 to 2018, dogs made up about 53% of intake.) | 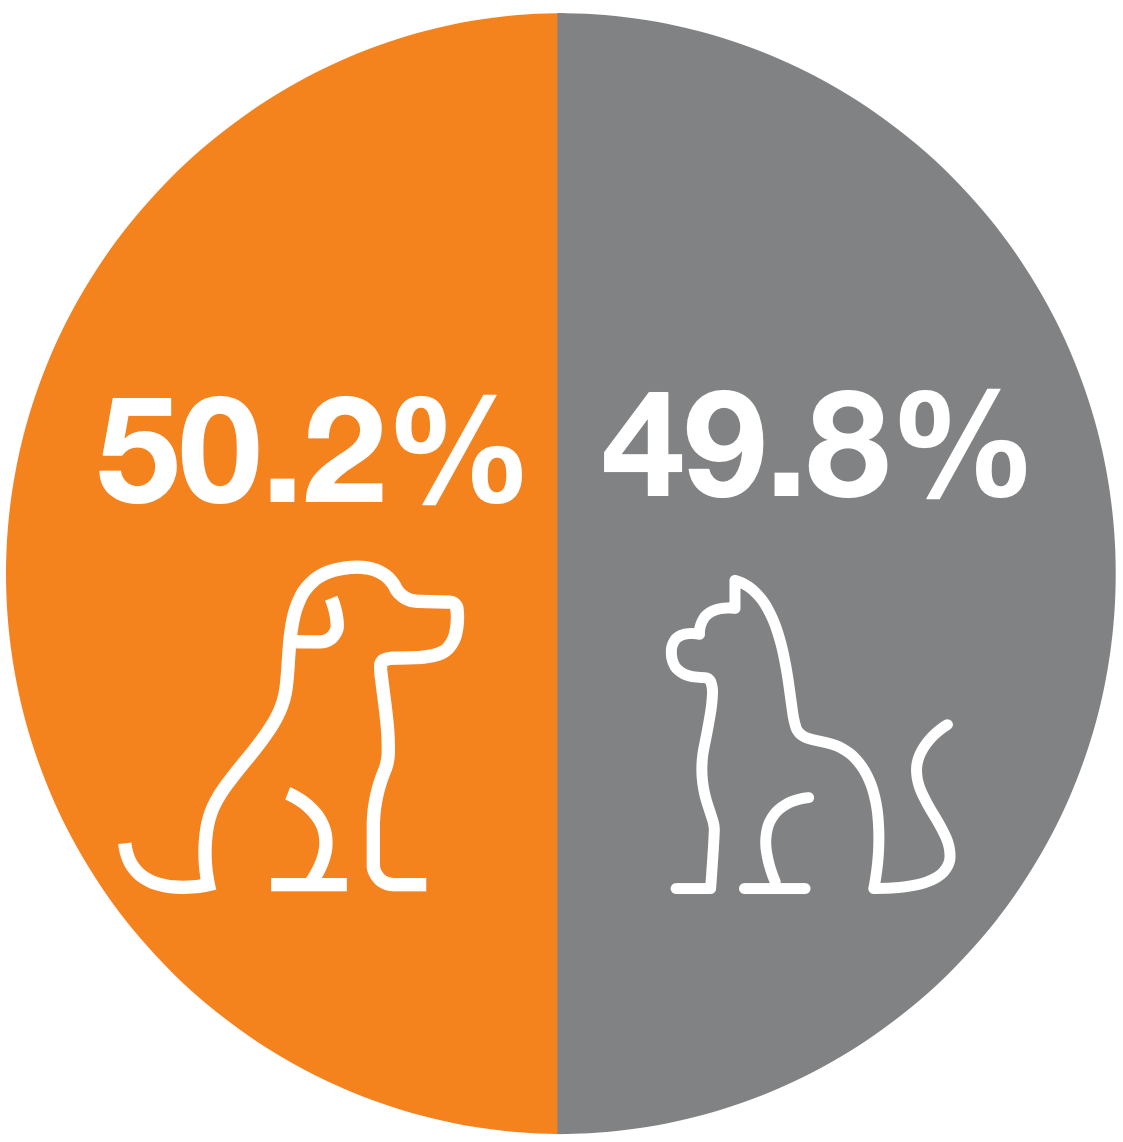 |
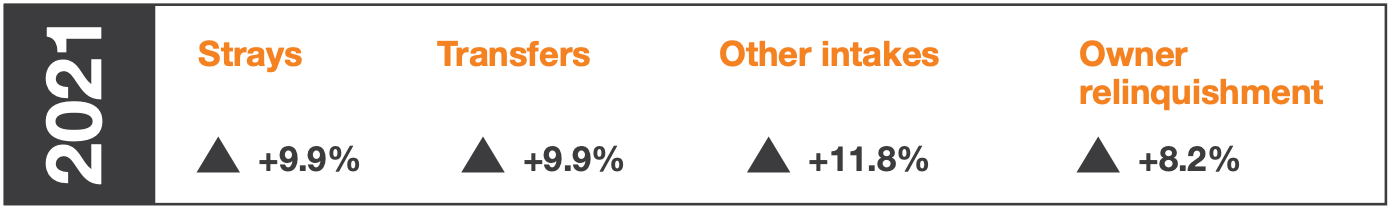
| In 2021, intake increased by 9.8%, outpacing that of both live outcomes and other outcomes. This resulted in increased shelter populations. | 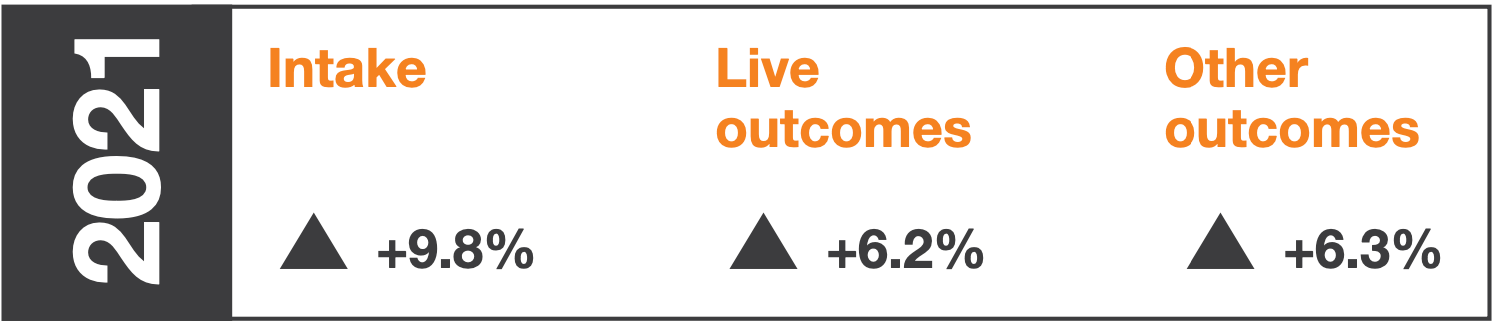 |
The increase in intake was driven more by strays, transfers, and other intakes rather than owner relinquishment. The increase in cat intake was 3% points higher than that of dogs.
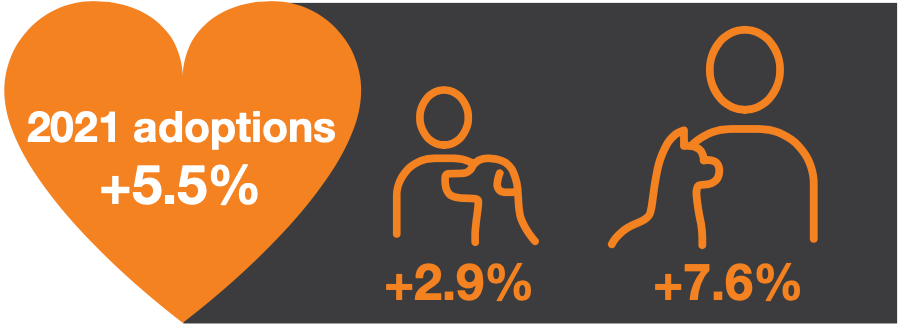
| Adoptions increased by 5.5% in 2021, a significantly lower increase than that of intake. This increase was driven more by cats than dogs. |
Methodology: Analysis of 1,766 shelters for which we have annual data from 2020 and 2021.
Types of intake and outcomes
The ways in which pets enter and leave shelters in the U.S. differ by species and highlight opportunities for improvement.

| Stray dogs and cats make up the majority of intake (52.1%) | |
| Cat intake is more concentrated in strays (54.3% cats vs. 49.8% dogs), with less cat intake coming from transfers and owner-intended euthanasia. | |
| Adoptions are a larger driver of live outcomes for cats (56.7% cats vs. 45.1% dogs). | |
| Cats are more likely to be euthanized or die in a shelter’s care. |
| Intake | Overall | Dogs | Cats |
| Stray at large | 52.1% | 49.8% | 54.3% |
| Relinquished by owner | 24.7% | 24.0% | 25.3% |
| Transferred in | 13.3% | 15.0% | 12.0% |
| Other intakes | 8.1% | 8.9% | 7.3% |
| Owner-intended euthanasia | 1.7% | 2.4% | 1.1% |
| Live outcomes | Overall | Dogs | Cats |
| Adoption | 50.7% | 45.1% | 56.7% |
| Returned to owner | 12.1% | 21.4% | 3.0% |
| Transferred out | 17.6% | 19.7% | 15.3% |
| Returned to field | 3.1% | 0.1% | 6.3% |
| Other live outcome | 1.5% | 1.2%% | 1.8% |
| Other outcomes | Overall | Dogs | Cats |
| Died in care | 1.7%% | 0.7% | 2.7% |
| Lost in care | 0.1% | 0.1% | 0.2% |
| Shelter euthanasia | 9.5% | 7.1% | 11.1% |
| Owner-intended euthanasia | 1.6% | 2.3% | 1.0% |
Methodology: Among the 2,007 shelters that reported fully categorized 2021 data, all numbers are a share of gross intake. Note: The dog returned-to-field number is likely due to reporting errors. Dogs were not actually returned to the field.
Community differences: urban/rural and social vulnerability
Communities influence the rates at which dogs and cats enter and leave shelters in the U.S. The level at which a community is rural and socially vulnerable correlates to higher intake volumes and lifesaving gaps.
![]() Intake per capita is lowest among the most urban counties (10.7 per 1,000 population) and highest among the most rural counties (25.0 per 1,000 population).
Intake per capita is lowest among the most urban counties (10.7 per 1,000 population) and highest among the most rural counties (25.0 per 1,000 population).
![]() Lifesaving gap per capita is lowest among the most urban counties (0.6 per 1,000 population) and highest among all ranges of rural counties (between 1.7 and 2.6).
Lifesaving gap per capita is lowest among the most urban counties (0.6 per 1,000 population) and highest among all ranges of rural counties (between 1.7 and 2.6).
![]() Cat intake is highest relative to dogs in urban counties, but lifesaving gap is lowest.
Cat intake is highest relative to dogs in urban counties, but lifesaving gap is lowest.
In the most urban counties: Cat intake is 50.8% and lifesaving gap is 61.8%.
In the most rural counties: Cat intake is 42.9% and lifesaving gap is 84.5%.
![]() Urban counties rely more heavily on adoptions for live outcomes (62.3% urban vs. 52.3% rural). Rural counties rely more heavily on transferring out pets (33.1% rural vs. 18.5% urban).
Urban counties rely more heavily on adoptions for live outcomes (62.3% urban vs. 52.3% rural). Rural counties rely more heavily on transferring out pets (33.1% rural vs. 18.5% urban).
![]() Social vulnerability is a significant factor in rates of intake and lifesaving gap, impacting both rural and urban counties. Rural counties that are the most socially vulnerable have the highest per capita rates of intake and lifesaving gap by a wide margin.
Social vulnerability is a significant factor in rates of intake and lifesaving gap, impacting both rural and urban counties. Rural counties that are the most socially vulnerable have the highest per capita rates of intake and lifesaving gap by a wide margin.
| Intake per 1,000 | High SVI | Moderate SVI | Low SVI |
| Rural | 27.4 | 19.6 | 16.1 |
| Urban | 17.4 | 12.4 | 9.1 |
| Total | 18.6 | 13.1 | 9.9 |
| Lifesaving gap per 1,000 | High SVI | Moderate SVI | Low SVI |
| Rural | 3.3 | 1.9 | 0.8 |
| Urban | 1.7 | 0.6 | 0.4 |
| Total | 1.9 | 0.7 | 0.5 |
SVI = Social Vulnerability Index
Sources: U.S. Census for rural scoring analyzed by decile; CDC for Social Vulnerability Index (SVI) analyzed by categories of high (70 or higher), moderate (30-69) and low (below 30).
Sustainability of 90% save rate
Despite the reversal of national intake and lifesaving gap trends in 2021, shelters that previously met the 90% save rate benchmark overwhelmingly maintained that status.
 | Of the shelters that were at the 90% save rate benchmark in 2020, 93.1% remained so in 2021. This is higher than the rates in 2018 and 2019. |
 | Among Best Friends Network Partners, 94.7% maintained the 90% save rate benchmark, compared to 90.3% of shelters that are not Best Friends Network Partners. |
 | Municipal shelters and shelters with an intake between 2,500 and 4,999 dogs and cats had the lowest chance of sustaining a 90% save rate. Even so, they sustained a 90% save rate 88.4% and 82.0% of the time, respectively. |
Methodology: Analysis of 1,222 shelters for which we have annual data for the years 2016–2021.