Analysis of Shelter Data: Rural vs. Urban Areas
The purpose of this analysis is to provide an exploration of shelter data based on county populations living in rural versus urban areas. Populations in rural areas face different challenges than populations in urban areas, including less access to resources such as veterinary services and shelter services. Counties with higher percentages of populations in rural areas also have lower median incomes and higher percentages of families living below the poverty line. This analysis identifies the challenges and strengths of shelters in more rural settings to inform strategies for supporting these communities in reaching the no-kill benchmark.
Data and methodology
The U.S. Census Bureau's urban/rural classification delineates geographical areas as urban or rural by population density. The census bureau assigns each member of the county population as being in either a rural or an urban area. The percentage is the share of the population that is in a rural area.
County urban/rural status has been categorized into four buckets, using the percentage of the county population living in a rural areas. These categories are:
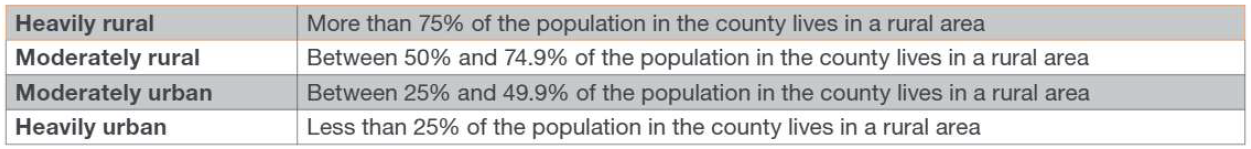
In some parts of the following analysis, 10% increments are used for showing rurality (0% = the entire county population lives in an urban area; 100% = the entire population lives in a rural area).
The Best Friends 2020 national dataset provided the shelter-level data for this analysis. More on this dataset can be found in the State of U.S. Animal Sheltering 2020 whitepaper.
Organization status breakdown
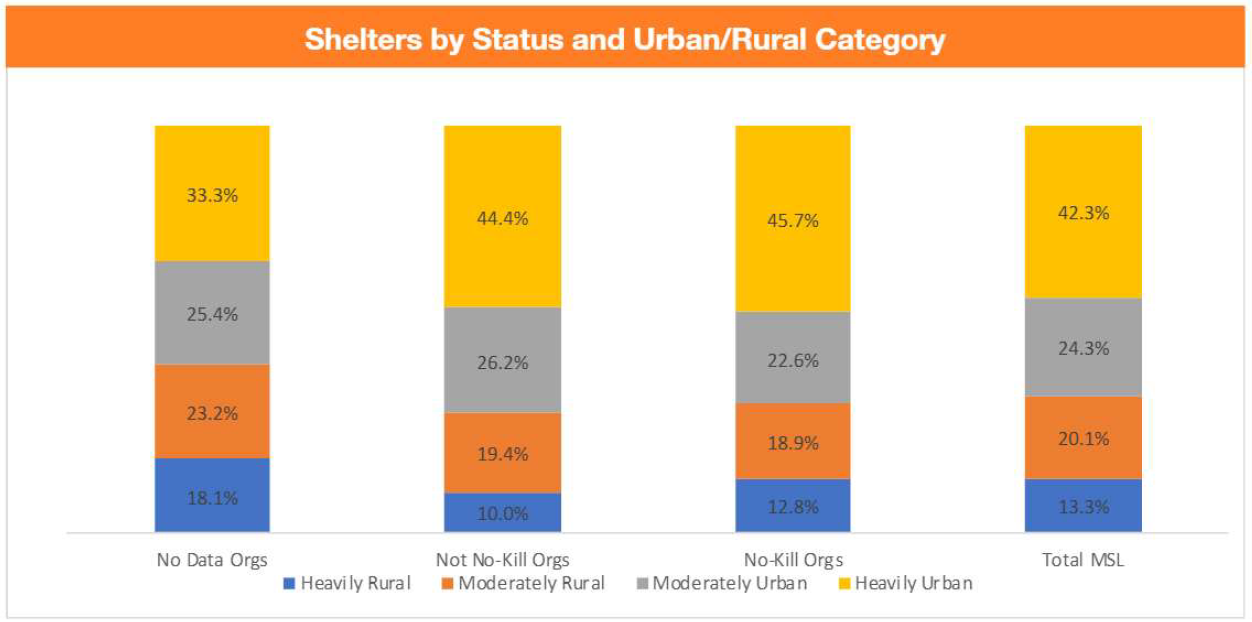
Based on the four urban/rural categories, there's a higher percentage of no-data shelters1 in counties with higher percentages of rural populations (41.2% are in moderately to heavily rural counties) than on the Best Friends master shelter list (MSL) overall (33.4% are in moderately to heavily rural counties). There is little difference in the distribution of not-no-kill organizations and no-kill organizations across urban/rural status, indicating that reaching no-kill is just as likely in rural areas as in urban areas.
Populations served
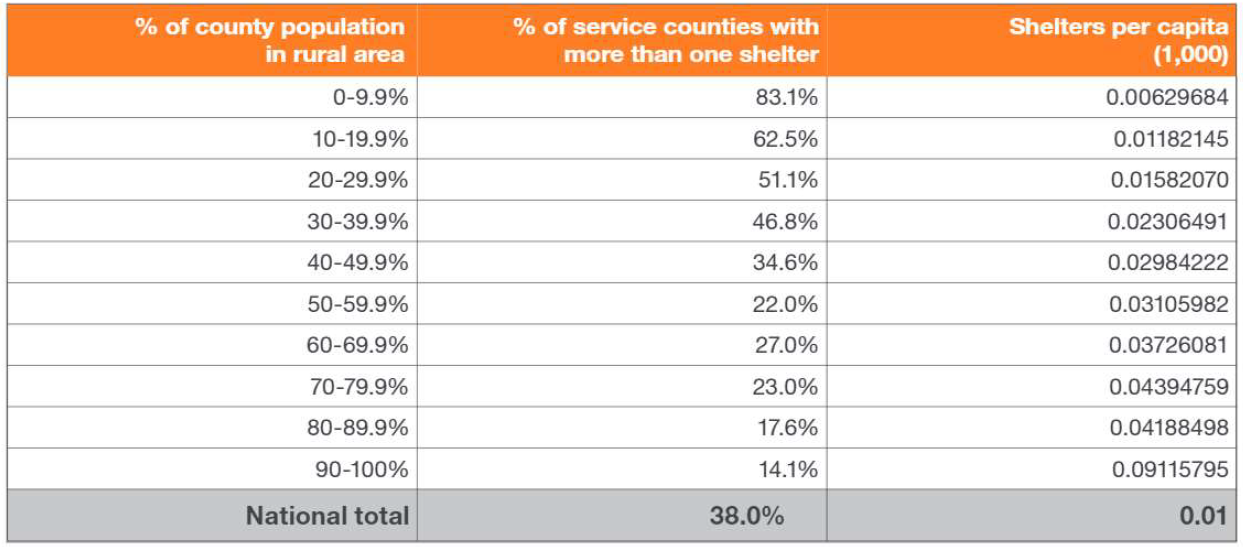
Nationally, 38.0% of counties have more than one brick-and-mortar shelter. The higher the percentage of population living in rural areas in the country, the less likely the counties are to have more than one shelter. However, each shelter in counties with more rural populations is serving fewer people than its urban counterparts.
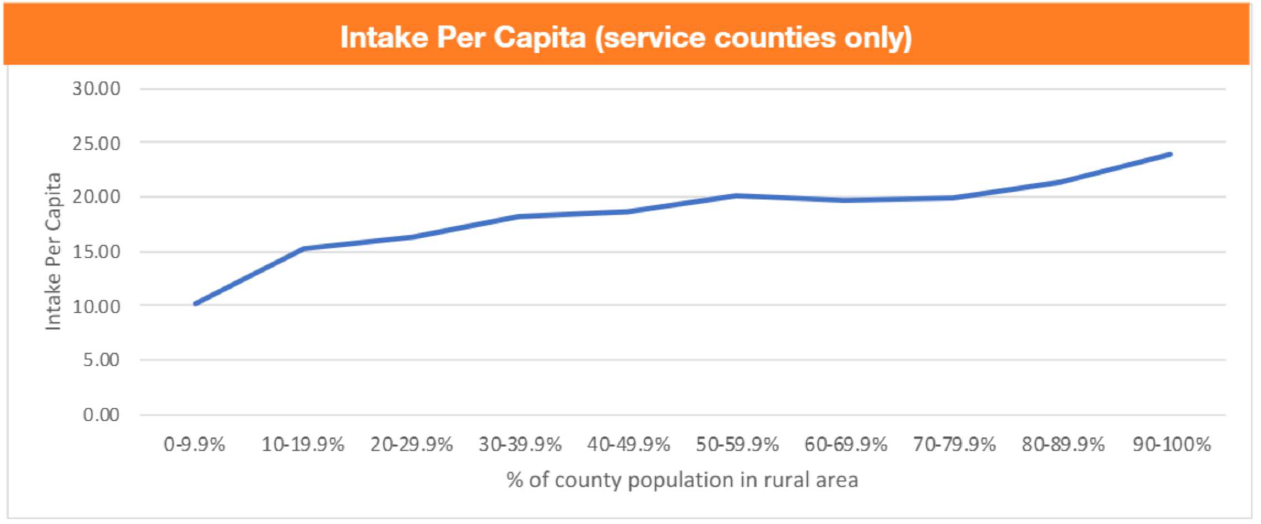
While the shelters are serving fewer people, intake per capita increases with rural populations.
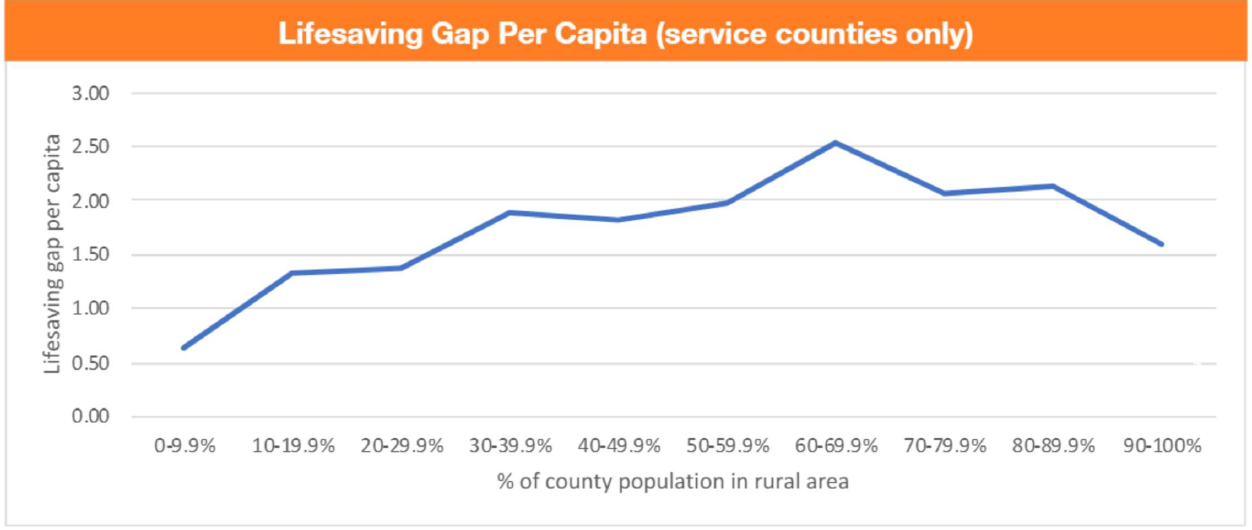
The lifesaving gap2 per capita also increases with percentage of population in a rural area, but it reaches its peak in counties with 60%-69% of the population living in rural areas and then dips back down as the percentage of population in a rural area increases.
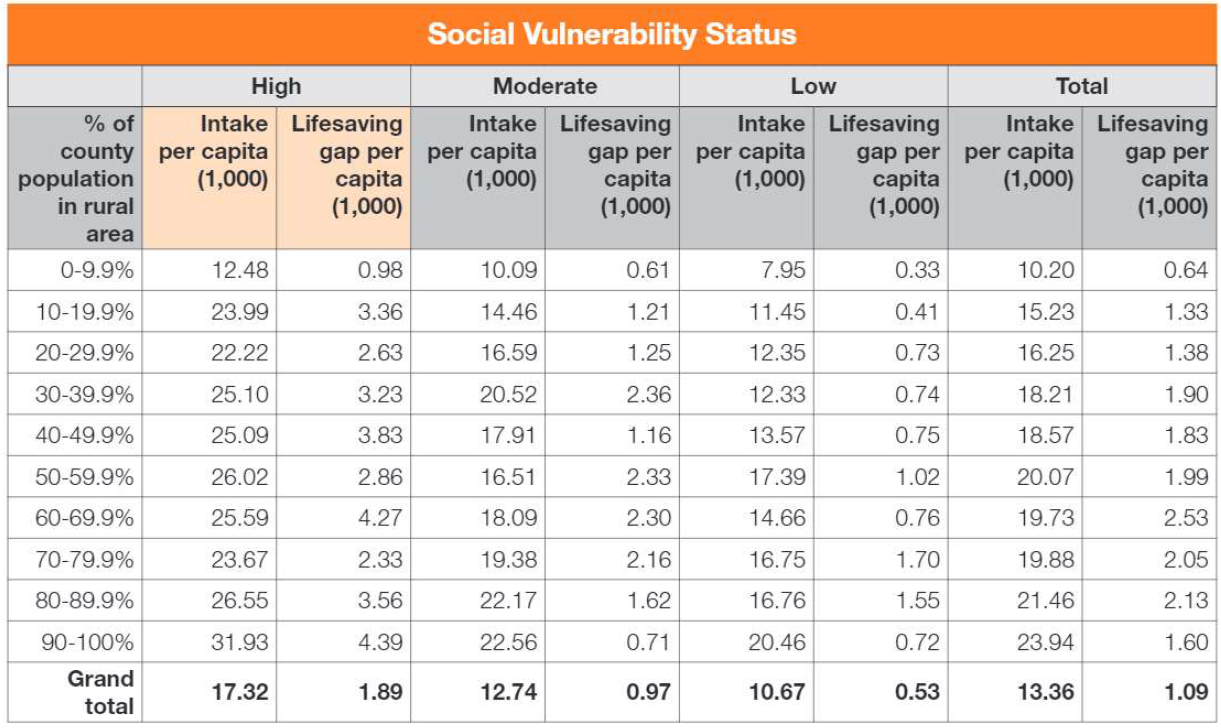
The CDC's Social Vulnerability Index assigns each county a percentile based on 15 demographic factors that impact a population's resiliency in times of disaster.3 Rurality has not been found to be directly correlated with vulnerability. However, counties with higher percentages of populations living in rural areas and high vulnerability do have higher intake per capita and higher lifesaving gap per capita than other counties, indicating that the counties where these two demographic indicators intersect may require additional support for lifesaving.
Species
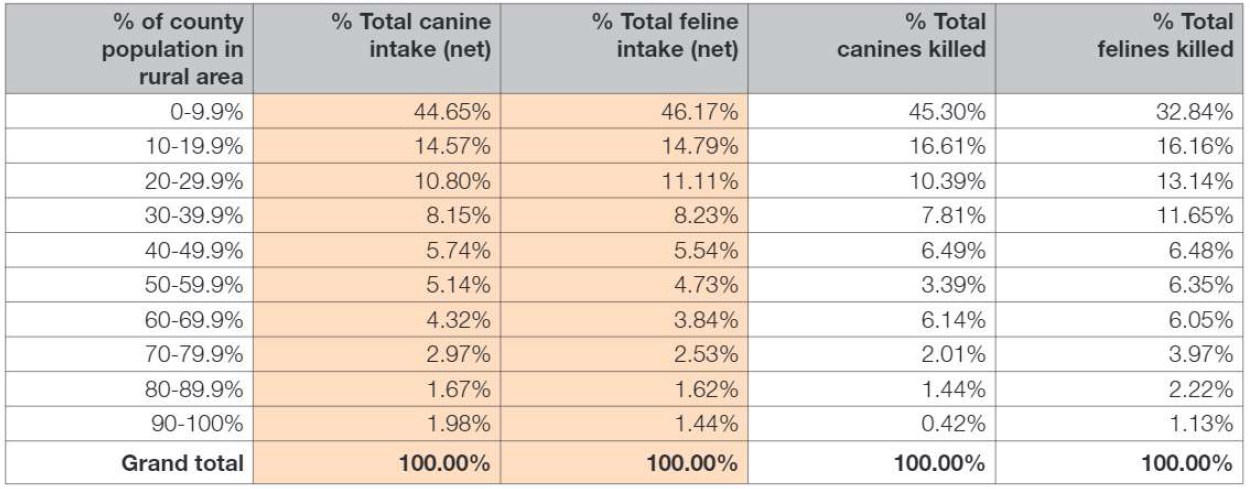
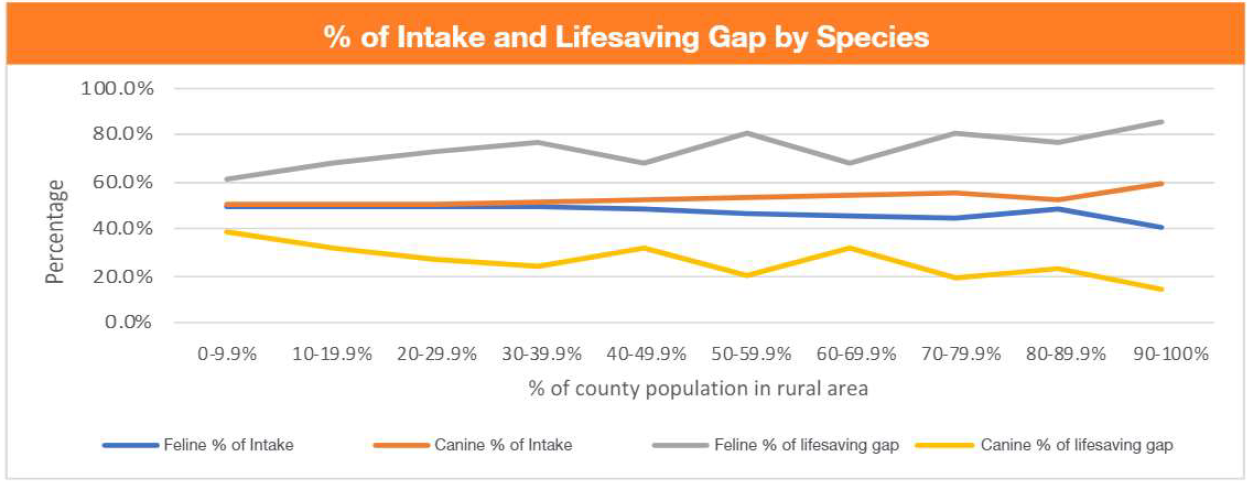
In both canines and felines, total intake decreases as the percentage of rural population increases. Most intake occurs in counties with 0%-9.9% of the population living in rural areas (44.7% of canine intake and 46.2% of feline intake).
Similarly, the lifesaving gap also decreases as the percentage of rural population increases. However, a higher portion of the canine lifesaving gap occurs in counties with 0%-9.9% of the population living in rural areas, while that percentage for felines is only 32.8%.
According to the national data, felines make up a lower percentage of intake and higher percentage of the lifesaving gap regardless of population rurality. However, the gap between the species in intake and the lifesaving gap increases as the percentage of rural population increases. Shelters in counties with more rural populations may require an additional supports in implementing feline lifesaving programs.
Intake subtypes
Intake types as a percentage of intake vary with rurality. Shelters in counties with more rural populations show strengths in less stray intake and owner-requested euthanasia (ORE) but may face challenges in owner surrenders.
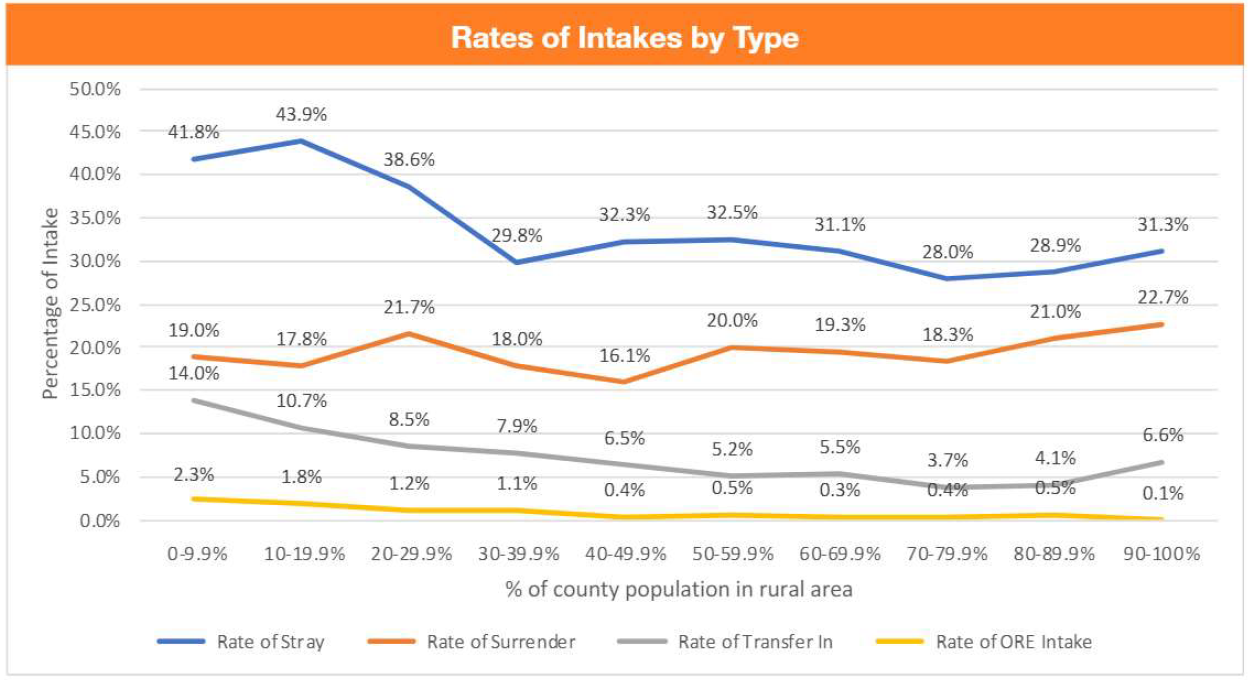
- Stray intakes makes up smaller portion of intake in counties with more rural populations than counties with less rural populations. This could indicate more neighbor-to-neighbor return-to-owner (RTO).
- Owner surrender rates are higher in counties with more rural populations. Understanding owner surrender reasons in counties with more rural populations would be helpful for understanding the specific challenges for these owners.
- A smaller portion of intake is owner-requested euthanasia in counties with a higher percentage of rural populations, indicating that either shelters in these counties do not offer this service or rural populations seek this support through other means.
- Shelters in areas of higher percentages of populations in rural areas have lower rates of transfers-in.
- There were no notable differences between species in regard to rates of intake type.
Outcome subtypes
Both live and non-live outcome types as a percentage of intake provide insight into what is happening to the animals who end up in shelters. Shelters in counties with more rural populations show strengths in return-to-owner and transfer-out programming but may face challenges in adoptions and return-to-field (RTF) programming.
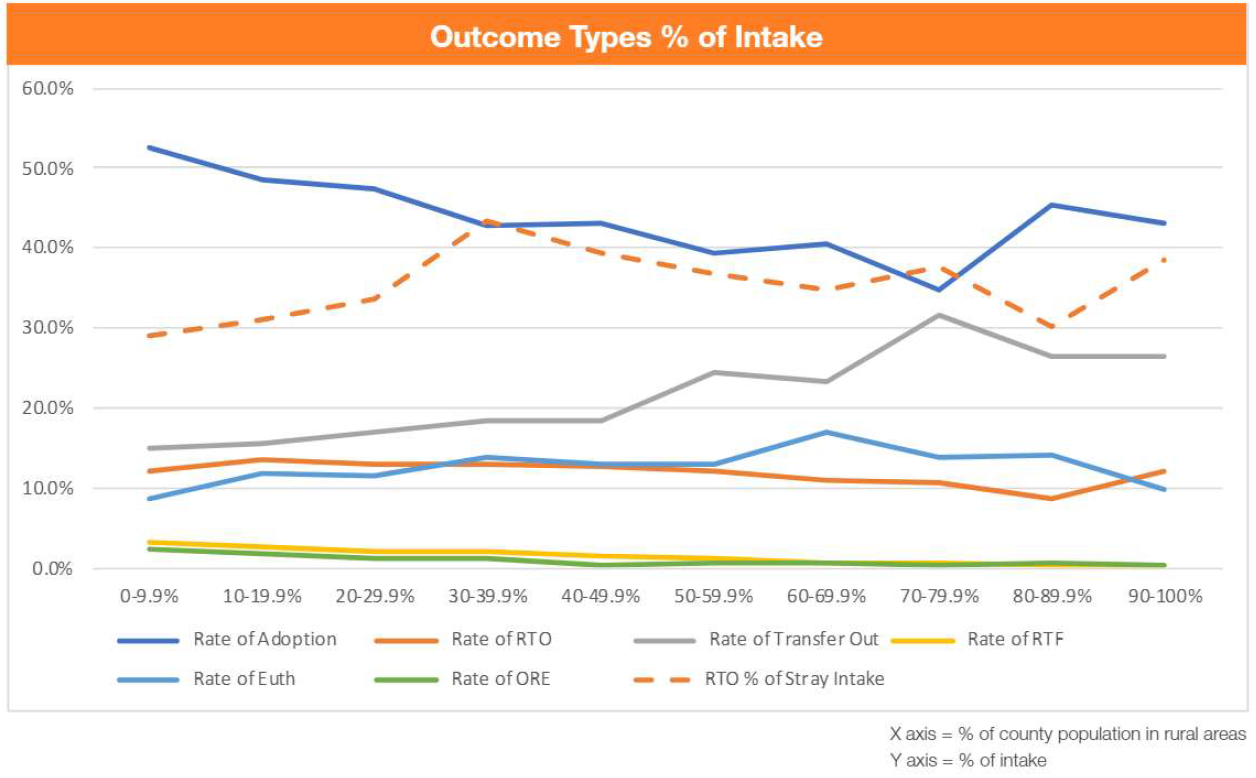
- Adoption as a percentage of intake decreases as the percentage of population in rural area increases, but there is a sharp increase in the counties with 80%+ population in rural area.
- Counties with higher percentages of rural populations have lower rates of return-to-owner (RTO), but they also have lower rates of stray intake. Therefore, when looking at RTO as a percentage of stray intake, rate of RTO trends up as the percentage of the county population a rural area increases. However, counties with 30%-39.9% of the population in a rural area have the highest RTO rate of stray intake (43.4%) and counties with 80%-89.9% had one of the lowest (30.1%).
- Rates of animals being transferred out increase as the percentage of population in rural areas increases.
- Rates of return-to-field (RTF) decrease as the percentage of population in rural area increases, with only 0.4% of intake in counties with 90%-100% of the population in rural area being returned to field, compared to 3.2% in counties with 0%-10% of rural populations. Access to veterinary resources in rural areas may be a barrier to RTF programs for cats.
- Euthanasia rates skew a bit higher as percentage of population in rural areas increases, but are highest in areas with more distribution of population between rural and urban areas (60%-69%).
- Owner-requested euthanasia (ORE) rates decrease as the portion of the population in the county in a rural area increases, corresponding to the rate of ORE intake.
- There were no notable differences between species in regard to rates of outcome type.
1 No-data shelters are brick-and-mortar shelters for which Best Friends does not currently have data, but that have been accounted for in the Best Friends master shelter list (MSL). The MSL lists 4,404 brick-and-mortar shelters across the country in 2020.
2 The lifesaving gap is the difference between the current save rate and the no-kill benchmark of a 90% save rate.
3 More information on the CDC's Social Vulnerability Index can be found here: https://network.bestfriends.org/research-data/research/human-pet-vulnerability-study