Summary of No-Kill Sustainability Analysis
The goal of this analysis is to understand the sustainability of no-kill status over time (2017-2020).

No-Kill Sustainability Summary
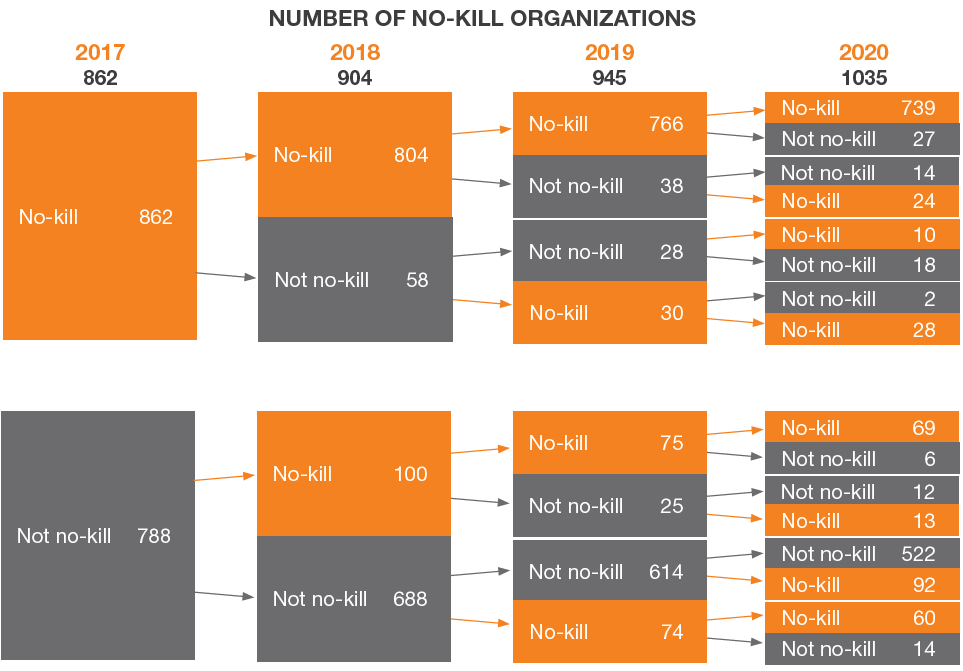
- The longer an organization is no-kill, the more likely it is to remain no-kill. An average of 93.7% of organizations that are no-kill remain no-kill the following year.
- 85.7% of organizations have remained no-kill for all four years (2017–2020).
- Overall, 92.9% of organizations that were no-kill in 2017 returned to or remained no-kill in 2020.
- On average, 51.7% of organizations that lose no-kill status in one year regain the status in the following year.
- Out of the original 1,650 organizations that have year-over-year data 2017–2020, 62.7% were no-kill in 2020 (a 20.1% increase of no-kill organizations overall, from 862 in 2017 to 1,035 in 2020).
"Not No-Kill" Changes
- On average, 15.4% of organizations that were not no-kill became no-kill the following year.
- 66.2% of “not no-kill” organizations remained “not no-kill” during the entire four-year period.
- 29.7% of “not no-kill” organizations in 2017 were no-kill in 2020.
Understanding No-Kill Sustainability by Organization Type
Increase in No-Kill Organizations
All organization types saw the greatest increase in number of no-kill organizations from 2019 to 2020.
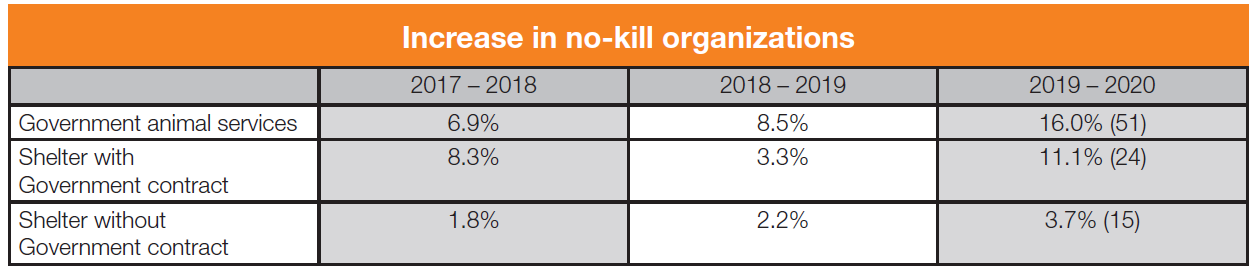
Overall, government animal services organizations that are no-kill increased by 34.7% from 2017 to 2020. This is higher than shelters with a government contract (24.4%) and shelters without a government contract (7.9%).
Percentage of No-Kill
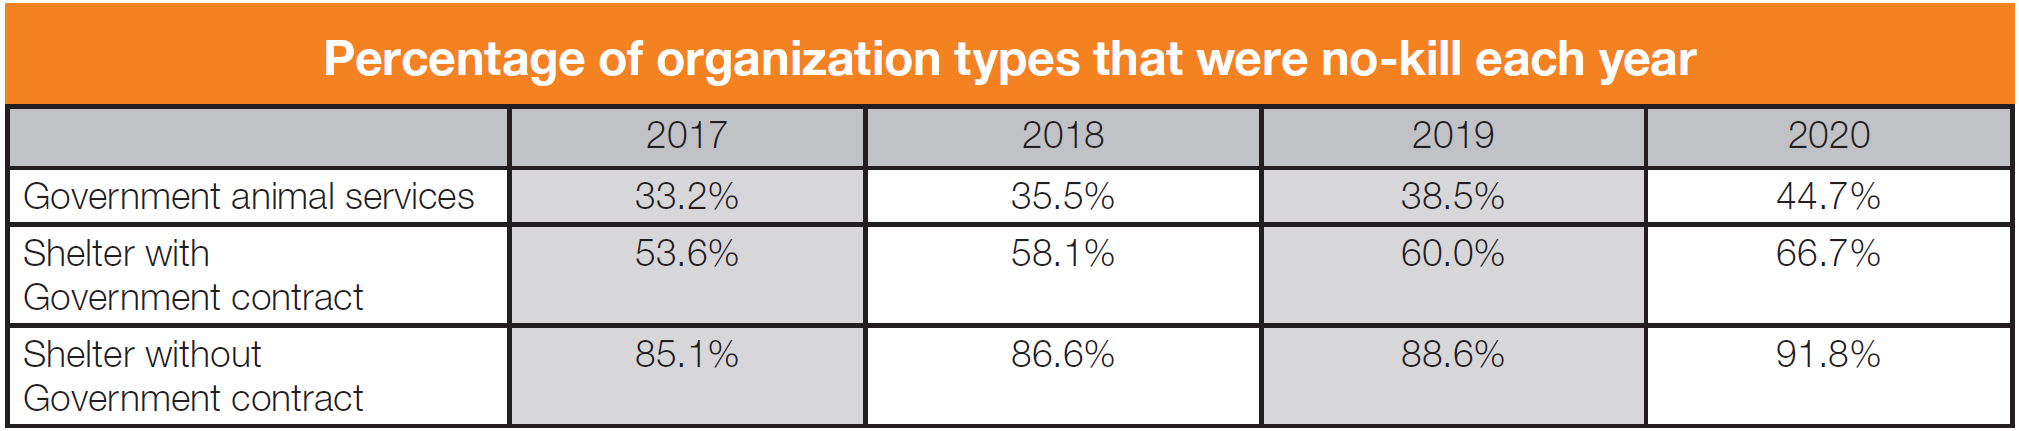
Government animal services organizations account for 825 (50.1%) of the total number of organizations that have a full four years of data (2017-2020). However, government animal services organizations only account for an average of 33.4% of no-kill organizations each year. A lower percentage of government animal services organizations are no-kill compared to other organization types (chart below).
Save Rate
No-kill government animal services organizations have a higher average save rate than shelters with a government contract, but it has decreased over the four-year period by 0.3 percentage points (95.7% in 2017 to 95.4% in 2020) while the average save rate for shelters with a government contract has increased by the same 0.3 percentage points (95.0% in 2017 to 95.3% in 2020).
No-Kill Sustainability
Government animal services organizations are less likely to remain no-kill year over year than shelters with a government contract and shelters without a government contract.
Government animal services organizations have a lower average for organizations that remain no-kill year over year (89.3%) compared to shelters with a government contract (93.8%) and shelters without a government contract (96.9%).
Government animal services organizations that lose their no-kill status are less likely to return to no-kill in the following year compared to shelters with a government contract and shelters without a government contract.
Regarding organizations that lose their no-kill status and return to it the following year, government animal services organizations have a lower average (41.8%) than shelters with a government contract (53.9%) and shelters without a government contract (72.0%).