
Human & Pet Vulnerability Study
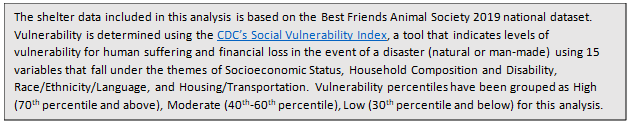
The goal of this analysis is to understand shelter intake and outcomes in the context of human vulnerability when faced with crisis.
DATA INSIGHTS
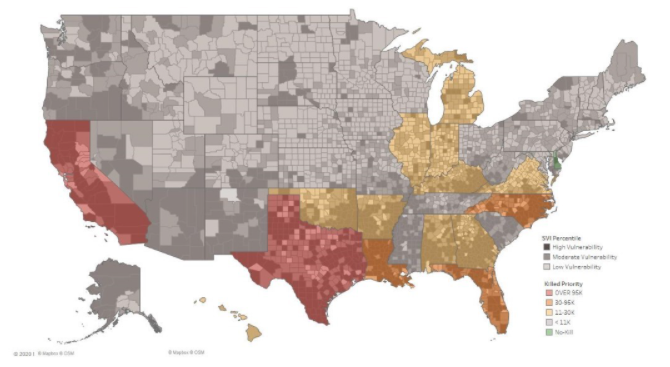
- Only 29.0% of the nation's total population lives in high vulnerability counties, yet 53.4% of the nation’s shelter animals that were killed were in these counties.
- A higher percentage of the nation’s net intake1 occurs in high vulnerability counties (38.9%) than in moderate or low vulnerability counties (35.8% and 25.4% respectively).
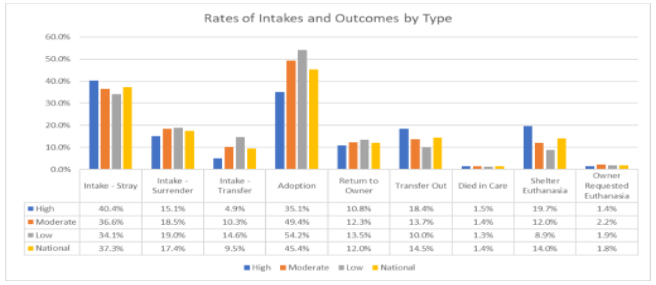
- Strays make up a higher rate of intake in high vulnerability counties (40.4%) than in the nation overall (37.3%).
- Animals are transferred out of shelters in high vulnerability counties at a higher rate (18.4%) than in the nation overall (14.5%), while animals are transferred into shelters in low vulnerability counties at a higher rate (14.6%) than in the nation overall (9.5%).
- In high vulnerability counties, the rate of adoptions is 35.1%, which is significantly lower than the national rate of 45.4%.
- A lower percentage of animals taken in are returned to owner in high vulnerability counties (10.8%) than in low vulnerability counties (13.5%) and the nation overall (12.0%).
- Moderate and low vulnerability counties have higher rates of owner requested euthanasia outcomes (2.2% and 1.9%, respectively) than high vulnerability counties (1.4%).
TOP 5 PRIORITY STATES
- 88.7% of the total shelter animals killed in CA are in high vulnerability counties, which comprise 57.3% of the state’s population.
- 66.8% of the total killed in TX are in high vulnerability counties while 59.6% of TX population is in high vulnerability counties.
- 53.8% of total killed in NC are in high vulnerability counties but only 31.0% of the population lives in those counties.
- 38.4% of the total killed in FL are in high vulnerability counties while only 25.1% of the population lives in those counties. (FL has a higher percentage of animals killed in moderate vulnerability counties than the other top states).
- Although only 58.8% of the population lives in high vulnerability counties in LA, 80.5% of the animals killed live in those areas.
Samantha Hill
Business Intelligence and Strategy
Best Friends Animal Society